Senegalese vs Immigrants from Australia Female Poverty Among 18-24 Year Olds
COMPARE
Senegalese
Immigrants from Australia
Female Poverty Among 18-24 Year Olds
Female Poverty Among 18-24 Year Olds Comparison
Senegalese
Immigrants from Australia
23.0%
FEMALE POVERTY AMONG 18-24 YEAR OLDS
0.0/ 100
METRIC RATING
303rd/ 347
METRIC RANK
20.9%
FEMALE POVERTY AMONG 18-24 YEAR OLDS
3.1/ 100
METRIC RATING
246th/ 347
METRIC RANK
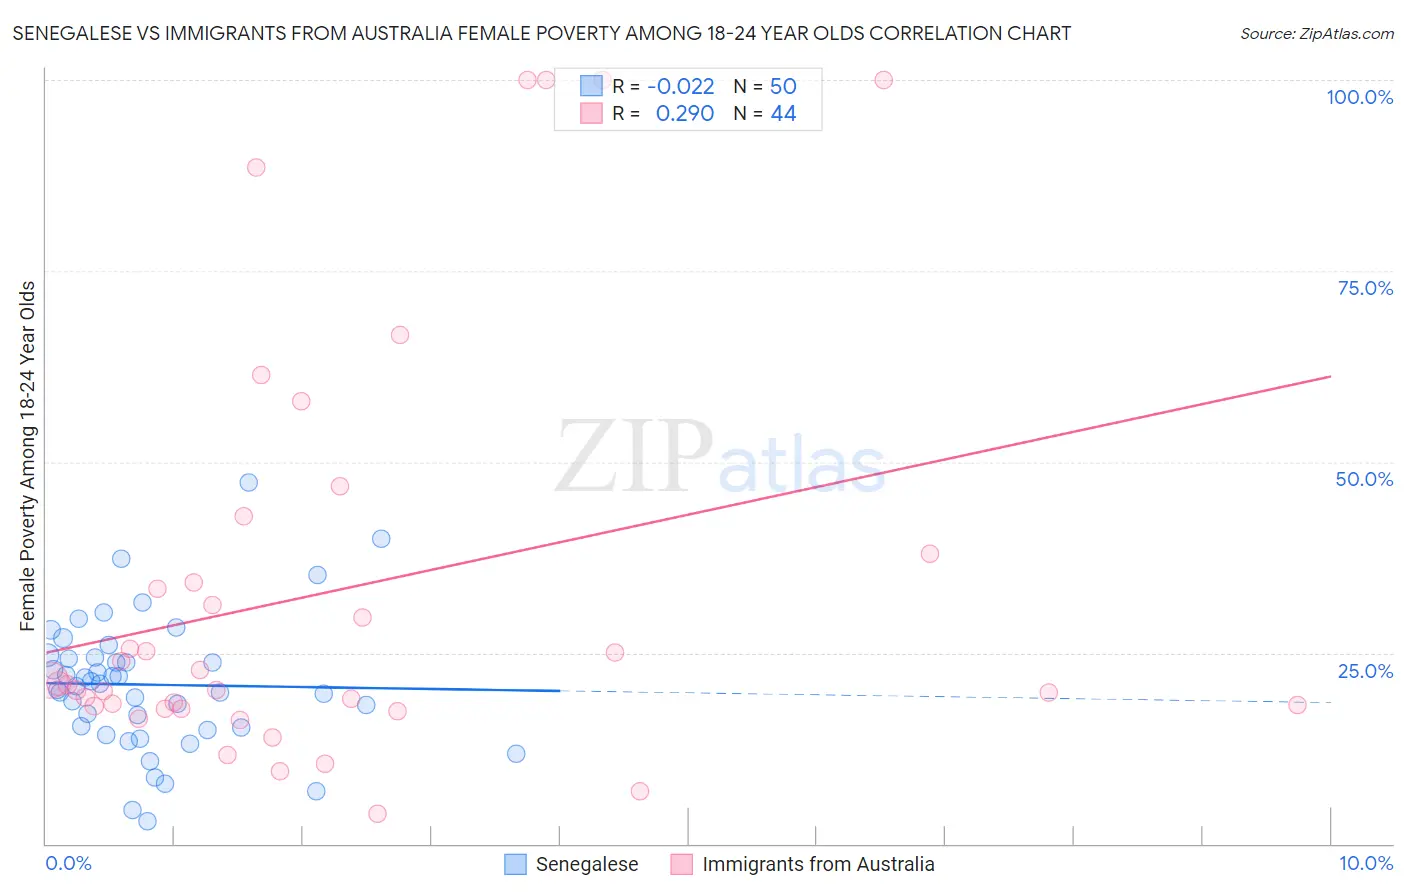
Senegalese vs Immigrants from Australia Female Poverty Among 18-24 Year Olds Correlation Chart
The statistical analysis conducted on geographies consisting of 77,908,610 people shows no correlation between the proportion of Senegalese and poverty level among females between the ages 18 and 24 in the United States with a correlation coefficient (R) of -0.022 and weighted average of 23.0%. Similarly, the statistical analysis conducted on geographies consisting of 223,617,185 people shows a weak positive correlation between the proportion of Immigrants from Australia and poverty level among females between the ages 18 and 24 in the United States with a correlation coefficient (R) of 0.290 and weighted average of 20.9%, a difference of 9.7%.
Female Poverty Among 18-24 Year Olds Correlation Summary
| Measurement | Senegalese | Immigrants from Australia |
| Minimum | 3.0% | 4.0% |
| Maximum | 47.4% | 100.0% |
| Range | 44.4% | 96.0% |
| Mean | 20.8% | 32.9% |
| Median | 20.8% | 20.9% |
| Interquartile 25% (IQ1) | 15.2% | 17.8% |
| Interquartile 75% (IQ3) | 24.4% | 36.1% |
| Interquartile Range (IQR) | 9.2% | 18.2% |
| Standard Deviation (Sample) | 8.7% | 27.0% |
| Standard Deviation (Population) | 8.6% | 26.7% |
Similar Demographics by Female Poverty Among 18-24 Year Olds
Demographics Similar to Senegalese by Female Poverty Among 18-24 Year Olds
In terms of female poverty among 18-24 year olds, the demographic groups most similar to Senegalese are Sudanese (23.0%, a difference of 0.14%), Iroquois (22.9%, a difference of 0.15%), Immigrants from Kuwait (23.0%, a difference of 0.19%), Seminole (22.9%, a difference of 0.54%), and African (22.8%, a difference of 0.63%).
| Demographics | Rating | Rank | Female Poverty Among 18-24 Year Olds |
| Menominee | 0.0 /100 | #296 | Tragic 22.5% |
| Inupiat | 0.0 /100 | #297 | Tragic 22.6% |
| Central American Indians | 0.0 /100 | #298 | Tragic 22.6% |
| Cherokee | 0.0 /100 | #299 | Tragic 22.7% |
| Africans | 0.0 /100 | #300 | Tragic 22.8% |
| Seminole | 0.0 /100 | #301 | Tragic 22.9% |
| Iroquois | 0.0 /100 | #302 | Tragic 22.9% |
| Senegalese | 0.0 /100 | #303 | Tragic 23.0% |
| Sudanese | 0.0 /100 | #304 | Tragic 23.0% |
| Immigrants | Kuwait | 0.0 /100 | #305 | Tragic 23.0% |
| Paiute | 0.0 /100 | #306 | Tragic 23.3% |
| Cree | 0.0 /100 | #307 | Tragic 23.4% |
| Immigrants | Sudan | 0.0 /100 | #308 | Tragic 23.5% |
| Blackfeet | 0.0 /100 | #309 | Tragic 23.6% |
| Comanche | 0.0 /100 | #310 | Tragic 23.6% |
Demographics Similar to Immigrants from Australia by Female Poverty Among 18-24 Year Olds
In terms of female poverty among 18-24 year olds, the demographic groups most similar to Immigrants from Australia are Immigrants from Africa (21.0%, a difference of 0.060%), Aleut (20.9%, a difference of 0.080%), Immigrants from Thailand (20.9%, a difference of 0.11%), Marshallese (20.9%, a difference of 0.12%), and Immigrants from Kenya (21.0%, a difference of 0.25%).
| Demographics | Rating | Rank | Female Poverty Among 18-24 Year Olds |
| Immigrants | Guatemala | 4.3 /100 | #239 | Tragic 20.9% |
| Luxembourgers | 4.2 /100 | #240 | Tragic 20.9% |
| Immigrants | Eritrea | 4.2 /100 | #241 | Tragic 20.9% |
| Israelis | 4.1 /100 | #242 | Tragic 20.9% |
| Marshallese | 3.4 /100 | #243 | Tragic 20.9% |
| Immigrants | Thailand | 3.4 /100 | #244 | Tragic 20.9% |
| Aleuts | 3.3 /100 | #245 | Tragic 20.9% |
| Immigrants | Australia | 3.1 /100 | #246 | Tragic 20.9% |
| Immigrants | Africa | 3.0 /100 | #247 | Tragic 21.0% |
| Immigrants | Kenya | 2.5 /100 | #248 | Tragic 21.0% |
| Carpatho Rusyns | 2.5 /100 | #249 | Tragic 21.0% |
| Immigrants | West Indies | 2.2 /100 | #250 | Tragic 21.0% |
| West Indians | 1.9 /100 | #251 | Tragic 21.1% |
| South Africans | 1.6 /100 | #252 | Tragic 21.1% |
| Delaware | 1.6 /100 | #253 | Tragic 21.1% |