Colombian vs Swedish Unemployment Among Seniors over 65 years
COMPARE
Colombian
Swedish
Unemployment Among Seniors over 65 years
Unemployment Among Seniors over 65 years Comparison
Colombians
Swedes
5.3%
UNEMPLOYMENT AMONG SENIORS OVER 65 YEARS
0.7/ 100
METRIC RATING
246th/ 347
METRIC RANK
4.9%
UNEMPLOYMENT AMONG SENIORS OVER 65 YEARS
99.9/ 100
METRIC RATING
52nd/ 347
METRIC RANK
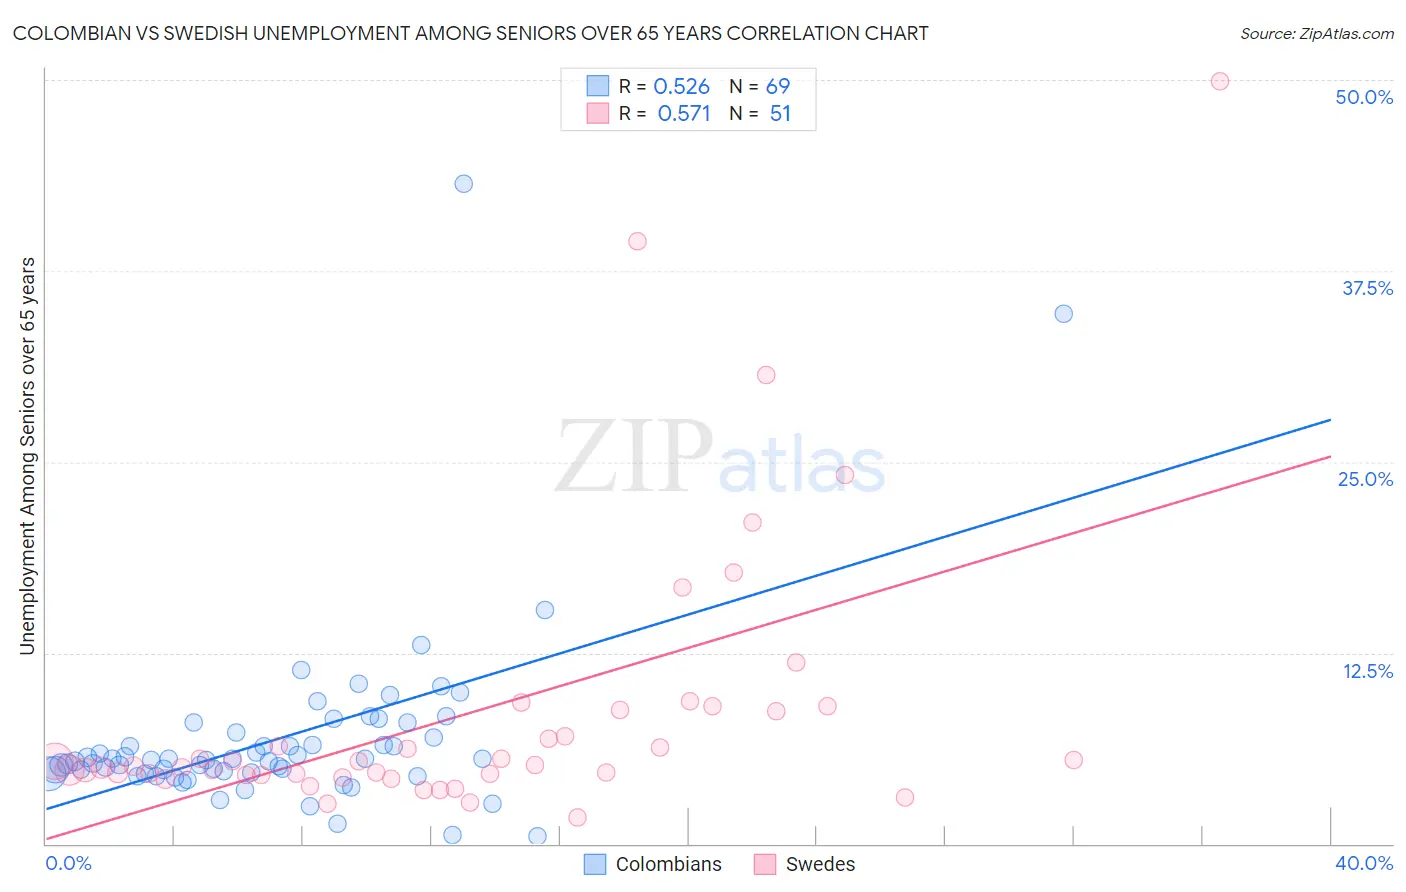
Colombian vs Swedish Unemployment Among Seniors over 65 years Correlation Chart
The statistical analysis conducted on geographies consisting of 378,422,595 people shows a substantial positive correlation between the proportion of Colombians and unemployment rate amomg seniors over the age of 65 in the United States with a correlation coefficient (R) of 0.526 and weighted average of 5.3%. Similarly, the statistical analysis conducted on geographies consisting of 445,176,213 people shows a substantial positive correlation between the proportion of Swedes and unemployment rate amomg seniors over the age of 65 in the United States with a correlation coefficient (R) of 0.571 and weighted average of 4.9%, a difference of 9.6%.
Unemployment Among Seniors over 65 years Correlation Summary
| Measurement | Colombian | Swedish |
| Minimum | 0.50% | 1.8% |
| Maximum | 43.2% | 49.9% |
| Range | 42.7% | 48.1% |
| Mean | 6.9% | 8.6% |
| Median | 5.5% | 5.1% |
| Interquartile 25% (IQ1) | 4.7% | 4.5% |
| Interquartile 75% (IQ3) | 7.1% | 8.8% |
| Interquartile Range (IQR) | 2.5% | 4.3% |
| Standard Deviation (Sample) | 6.2% | 9.3% |
| Standard Deviation (Population) | 6.1% | 9.2% |
Similar Demographics by Unemployment Among Seniors over 65 years
Demographics Similar to Colombians by Unemployment Among Seniors over 65 years
In terms of unemployment among seniors over 65 years, the demographic groups most similar to Colombians are Ottawa (5.3%, a difference of 0.030%), Peruvian (5.3%, a difference of 0.040%), Immigrants from Caribbean (5.3%, a difference of 0.040%), French Canadian (5.4%, a difference of 0.090%), and Immigrants (5.4%, a difference of 0.11%).
| Demographics | Rating | Rank | Unemployment Among Seniors over 65 years |
| Immigrants | Senegal | 1.8 /100 | #239 | Tragic 5.3% |
| Immigrants | Trinidad and Tobago | 1.6 /100 | #240 | Tragic 5.3% |
| Apache | 1.3 /100 | #241 | Tragic 5.3% |
| Bahamians | 0.9 /100 | #242 | Tragic 5.3% |
| Nigerians | 0.9 /100 | #243 | Tragic 5.3% |
| Peruvians | 0.8 /100 | #244 | Tragic 5.3% |
| Ottawa | 0.8 /100 | #245 | Tragic 5.3% |
| Colombians | 0.7 /100 | #246 | Tragic 5.3% |
| Immigrants | Caribbean | 0.7 /100 | #247 | Tragic 5.3% |
| French Canadians | 0.7 /100 | #248 | Tragic 5.4% |
| Immigrants | Immigrants | 0.6 /100 | #249 | Tragic 5.4% |
| Ghanaians | 0.6 /100 | #250 | Tragic 5.4% |
| West Indians | 0.6 /100 | #251 | Tragic 5.4% |
| Trinidadians and Tobagonians | 0.6 /100 | #252 | Tragic 5.4% |
| Immigrants | Sierra Leone | 0.6 /100 | #253 | Tragic 5.4% |
Demographics Similar to Swedes by Unemployment Among Seniors over 65 years
In terms of unemployment among seniors over 65 years, the demographic groups most similar to Swedes are Scotch-Irish (4.9%, a difference of 0.020%), Immigrants from Sudan (4.9%, a difference of 0.040%), Immigrants from Iraq (4.9%, a difference of 0.10%), European (4.9%, a difference of 0.12%), and Immigrants from Austria (4.9%, a difference of 0.14%).
| Demographics | Rating | Rank | Unemployment Among Seniors over 65 years |
| Ethiopians | 99.9 /100 | #45 | Exceptional 4.9% |
| Immigrants | Jordan | 99.9 /100 | #46 | Exceptional 4.9% |
| Germans | 99.9 /100 | #47 | Exceptional 4.9% |
| Choctaw | 99.9 /100 | #48 | Exceptional 4.9% |
| Immigrants | Kenya | 99.9 /100 | #49 | Exceptional 4.9% |
| Immigrants | Austria | 99.9 /100 | #50 | Exceptional 4.9% |
| Scotch-Irish | 99.9 /100 | #51 | Exceptional 4.9% |
| Swedes | 99.9 /100 | #52 | Exceptional 4.9% |
| Immigrants | Sudan | 99.8 /100 | #53 | Exceptional 4.9% |
| Immigrants | Iraq | 99.8 /100 | #54 | Exceptional 4.9% |
| Europeans | 99.8 /100 | #55 | Exceptional 4.9% |
| Carpatho Rusyns | 99.8 /100 | #56 | Exceptional 4.9% |
| Danes | 99.8 /100 | #57 | Exceptional 4.9% |
| Scandinavians | 99.8 /100 | #58 | Exceptional 4.9% |
| Immigrants | Eastern Africa | 99.7 /100 | #59 | Exceptional 4.9% |