Colombian vs Swiss Family Poverty
COMPARE
Colombian
Swiss
Family Poverty
Family Poverty Comparison
Colombians
Swiss
9.2%
FAMILY POVERTY
36.1/ 100
METRIC RATING
186th/ 347
METRIC RANK
7.7%
FAMILY POVERTY
98.8/ 100
METRIC RATING
53rd/ 347
METRIC RANK
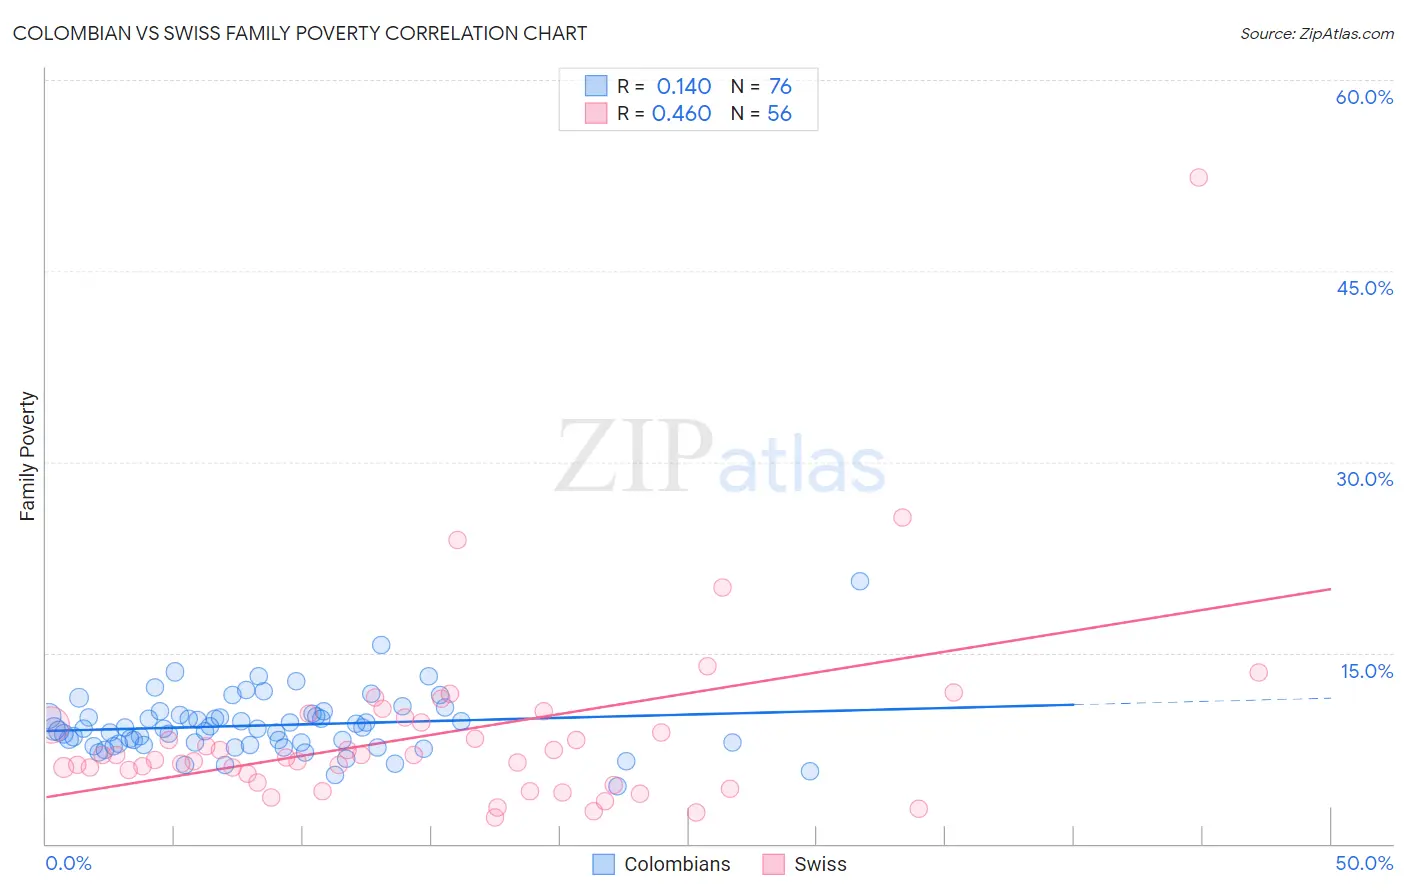
Colombian vs Swiss Family Poverty Correlation Chart
The statistical analysis conducted on geographies consisting of 418,403,011 people shows a poor positive correlation between the proportion of Colombians and poverty level among families in the United States with a correlation coefficient (R) of 0.140 and weighted average of 9.2%. Similarly, the statistical analysis conducted on geographies consisting of 462,917,875 people shows a moderate positive correlation between the proportion of Swiss and poverty level among families in the United States with a correlation coefficient (R) of 0.460 and weighted average of 7.7%, a difference of 18.9%.
Family Poverty Correlation Summary
| Measurement | Colombian | Swiss |
| Minimum | 4.5% | 2.1% |
| Maximum | 20.6% | 52.4% |
| Range | 16.1% | 50.3% |
| Mean | 9.3% | 8.6% |
| Median | 9.0% | 6.9% |
| Interquartile 25% (IQ1) | 7.8% | 5.1% |
| Interquartile 75% (IQ3) | 10.1% | 9.7% |
| Interquartile Range (IQR) | 2.3% | 4.6% |
| Standard Deviation (Sample) | 2.4% | 7.6% |
| Standard Deviation (Population) | 2.4% | 7.5% |
Similar Demographics by Family Poverty
Demographics Similar to Colombians by Family Poverty
In terms of family poverty, the demographic groups most similar to Colombians are Delaware (9.2%, a difference of 0.090%), Immigrants from Kenya (9.2%, a difference of 0.29%), Immigrants from Saudi Arabia (9.1%, a difference of 0.35%), South American Indian (9.1%, a difference of 0.36%), and Uruguayan (9.1%, a difference of 0.43%).
| Demographics | Rating | Rank | Family Poverty |
| Immigrants | Iraq | 44.4 /100 | #179 | Average 9.1% |
| Immigrants | Uganda | 43.4 /100 | #180 | Average 9.1% |
| Hmong | 40.2 /100 | #181 | Average 9.1% |
| Immigrants | Morocco | 40.2 /100 | #182 | Average 9.1% |
| Uruguayans | 39.2 /100 | #183 | Fair 9.1% |
| South American Indians | 38.7 /100 | #184 | Fair 9.1% |
| Immigrants | Saudi Arabia | 38.6 /100 | #185 | Fair 9.1% |
| Colombians | 36.1 /100 | #186 | Fair 9.2% |
| Delaware | 35.4 /100 | #187 | Fair 9.2% |
| Immigrants | Kenya | 34.0 /100 | #188 | Fair 9.2% |
| Immigrants | Afghanistan | 32.1 /100 | #189 | Fair 9.2% |
| Arabs | 31.5 /100 | #190 | Fair 9.2% |
| Ugandans | 28.7 /100 | #191 | Fair 9.3% |
| Spanish | 28.7 /100 | #192 | Fair 9.3% |
| Immigrants | Western Asia | 28.2 /100 | #193 | Fair 9.3% |
Demographics Similar to Swiss by Family Poverty
In terms of family poverty, the demographic groups most similar to Swiss are Immigrants from Sweden (7.7%, a difference of 0.010%), Immigrants from Eastern Asia (7.7%, a difference of 0.040%), Indian (Asian) (7.7%, a difference of 0.060%), Immigrants from Serbia (7.7%, a difference of 0.080%), and Asian (7.7%, a difference of 0.17%).
| Demographics | Rating | Rank | Family Poverty |
| Tongans | 98.9 /100 | #46 | Exceptional 7.7% |
| Immigrants | Czechoslovakia | 98.9 /100 | #47 | Exceptional 7.7% |
| Immigrants | Sri Lanka | 98.9 /100 | #48 | Exceptional 7.7% |
| Immigrants | Bolivia | 98.9 /100 | #49 | Exceptional 7.7% |
| Immigrants | North Macedonia | 98.9 /100 | #50 | Exceptional 7.7% |
| Immigrants | Moldova | 98.8 /100 | #51 | Exceptional 7.7% |
| Indians (Asian) | 98.8 /100 | #52 | Exceptional 7.7% |
| Swiss | 98.8 /100 | #53 | Exceptional 7.7% |
| Immigrants | Sweden | 98.8 /100 | #54 | Exceptional 7.7% |
| Immigrants | Eastern Asia | 98.7 /100 | #55 | Exceptional 7.7% |
| Immigrants | Serbia | 98.7 /100 | #56 | Exceptional 7.7% |
| Asians | 98.7 /100 | #57 | Exceptional 7.7% |
| Finns | 98.7 /100 | #58 | Exceptional 7.7% |
| Europeans | 98.7 /100 | #59 | Exceptional 7.7% |
| Immigrants | Greece | 98.7 /100 | #60 | Exceptional 7.7% |