Colombian vs Immigrants from Grenada Female Poverty Among 18-24 Year Olds
COMPARE
Colombian
Immigrants from Grenada
Female Poverty Among 18-24 Year Olds
Female Poverty Among 18-24 Year Olds Comparison
Colombians
Immigrants from Grenada
17.7%
FEMALE POVERTY AMONG 18-24 YEAR OLDS
100.0/ 100
METRIC RATING
27th/ 347
METRIC RANK
21.2%
FEMALE POVERTY AMONG 18-24 YEAR OLDS
1.2/ 100
METRIC RATING
255th/ 347
METRIC RANK
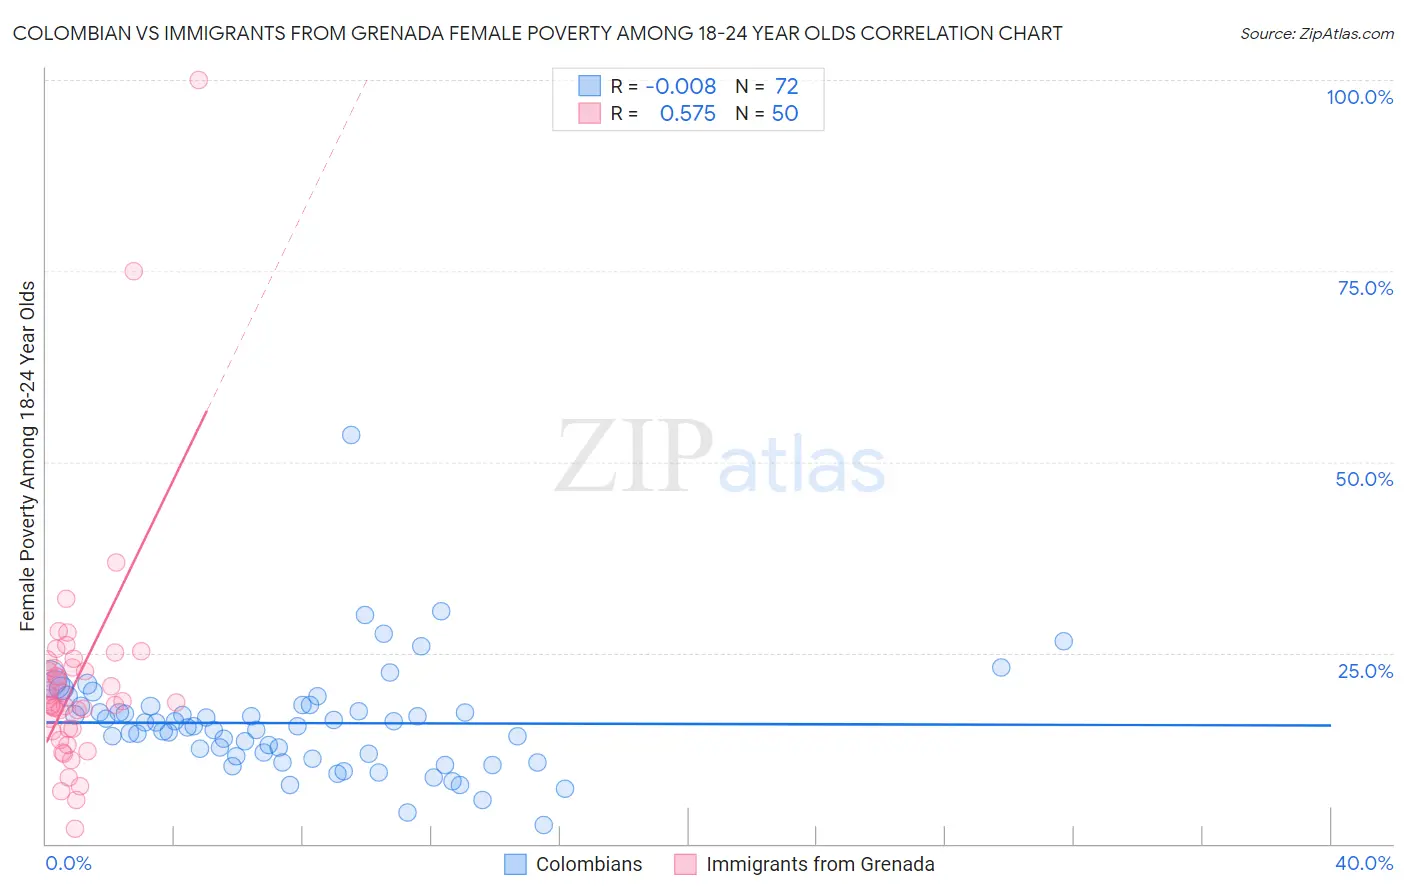
Colombian vs Immigrants from Grenada Female Poverty Among 18-24 Year Olds Correlation Chart
The statistical analysis conducted on geographies consisting of 408,743,198 people shows no correlation between the proportion of Colombians and poverty level among females between the ages 18 and 24 in the United States with a correlation coefficient (R) of -0.008 and weighted average of 17.7%. Similarly, the statistical analysis conducted on geographies consisting of 66,763,632 people shows a substantial positive correlation between the proportion of Immigrants from Grenada and poverty level among females between the ages 18 and 24 in the United States with a correlation coefficient (R) of 0.575 and weighted average of 21.2%, a difference of 19.9%.
Female Poverty Among 18-24 Year Olds Correlation Summary
| Measurement | Colombian | Immigrants from Grenada |
| Minimum | 2.5% | 2.0% |
| Maximum | 53.6% | 100.0% |
| Range | 51.0% | 98.0% |
| Mean | 15.8% | 21.4% |
| Median | 15.4% | 18.6% |
| Interquartile 25% (IQ1) | 11.6% | 15.0% |
| Interquartile 75% (IQ3) | 18.0% | 23.1% |
| Interquartile Range (IQR) | 6.4% | 8.1% |
| Standard Deviation (Sample) | 7.1% | 15.4% |
| Standard Deviation (Population) | 7.1% | 15.2% |
Similar Demographics by Female Poverty Among 18-24 Year Olds
Demographics Similar to Colombians by Female Poverty Among 18-24 Year Olds
In terms of female poverty among 18-24 year olds, the demographic groups most similar to Colombians are Immigrants from Fiji (17.7%, a difference of 0.11%), Venezuelan (17.7%, a difference of 0.14%), Immigrants from South Central Asia (17.6%, a difference of 0.43%), Portuguese (17.8%, a difference of 0.47%), and Maltese (17.6%, a difference of 0.61%).
| Demographics | Rating | Rank | Female Poverty Among 18-24 Year Olds |
| Immigrants | Venezuela | 100.0 /100 | #20 | Exceptional 17.4% |
| Bolivians | 100.0 /100 | #21 | Exceptional 17.4% |
| Immigrants | Hong Kong | 100.0 /100 | #22 | Exceptional 17.5% |
| Immigrants | North Macedonia | 100.0 /100 | #23 | Exceptional 17.6% |
| Maltese | 100.0 /100 | #24 | Exceptional 17.6% |
| Immigrants | South Central Asia | 100.0 /100 | #25 | Exceptional 17.6% |
| Immigrants | Fiji | 100.0 /100 | #26 | Exceptional 17.7% |
| Colombians | 100.0 /100 | #27 | Exceptional 17.7% |
| Venezuelans | 100.0 /100 | #28 | Exceptional 17.7% |
| Portuguese | 100.0 /100 | #29 | Exceptional 17.8% |
| Immigrants | South Eastern Asia | 100.0 /100 | #30 | Exceptional 17.8% |
| Immigrants | Vietnam | 100.0 /100 | #31 | Exceptional 17.8% |
| Immigrants | Moldova | 100.0 /100 | #32 | Exceptional 17.9% |
| Native Hawaiians | 100.0 /100 | #33 | Exceptional 17.9% |
| Immigrants | Nicaragua | 100.0 /100 | #34 | Exceptional 17.9% |
Demographics Similar to Immigrants from Grenada by Female Poverty Among 18-24 Year Olds
In terms of female poverty among 18-24 year olds, the demographic groups most similar to Immigrants from Grenada are British West Indian (21.2%, a difference of 0.030%), Tsimshian (21.2%, a difference of 0.15%), Taiwanese (21.2%, a difference of 0.26%), Delaware (21.1%, a difference of 0.32%), and South African (21.1%, a difference of 0.36%).
| Demographics | Rating | Rank | Female Poverty Among 18-24 Year Olds |
| Immigrants | Kenya | 2.5 /100 | #248 | Tragic 21.0% |
| Carpatho Rusyns | 2.5 /100 | #249 | Tragic 21.0% |
| Immigrants | West Indies | 2.2 /100 | #250 | Tragic 21.0% |
| West Indians | 1.9 /100 | #251 | Tragic 21.1% |
| South Africans | 1.6 /100 | #252 | Tragic 21.1% |
| Delaware | 1.6 /100 | #253 | Tragic 21.1% |
| British West Indians | 1.2 /100 | #254 | Tragic 21.2% |
| Immigrants | Grenada | 1.2 /100 | #255 | Tragic 21.2% |
| Tsimshian | 1.0 /100 | #256 | Tragic 21.2% |
| Taiwanese | 1.0 /100 | #257 | Tragic 21.2% |
| Vietnamese | 0.6 /100 | #258 | Tragic 21.4% |
| Immigrants | France | 0.6 /100 | #259 | Tragic 21.4% |
| Immigrants | Norway | 0.6 /100 | #260 | Tragic 21.4% |
| Immigrants | Bahamas | 0.5 /100 | #261 | Tragic 21.4% |
| Immigrants | Eastern Africa | 0.4 /100 | #262 | Tragic 21.4% |