Immigrants from South America vs Ecuadorian Female Poverty Among 18-24 Year Olds
COMPARE
Immigrants from South America
Ecuadorian
Female Poverty Among 18-24 Year Olds
Female Poverty Among 18-24 Year Olds Comparison
Immigrants from South America
Ecuadorians
17.9%
FEMALE POVERTY AMONG 18-24 YEAR OLDS
100.0/ 100
METRIC RATING
36th/ 347
METRIC RANK
19.1%
FEMALE POVERTY AMONG 18-24 YEAR OLDS
98.1/ 100
METRIC RATING
101st/ 347
METRIC RANK
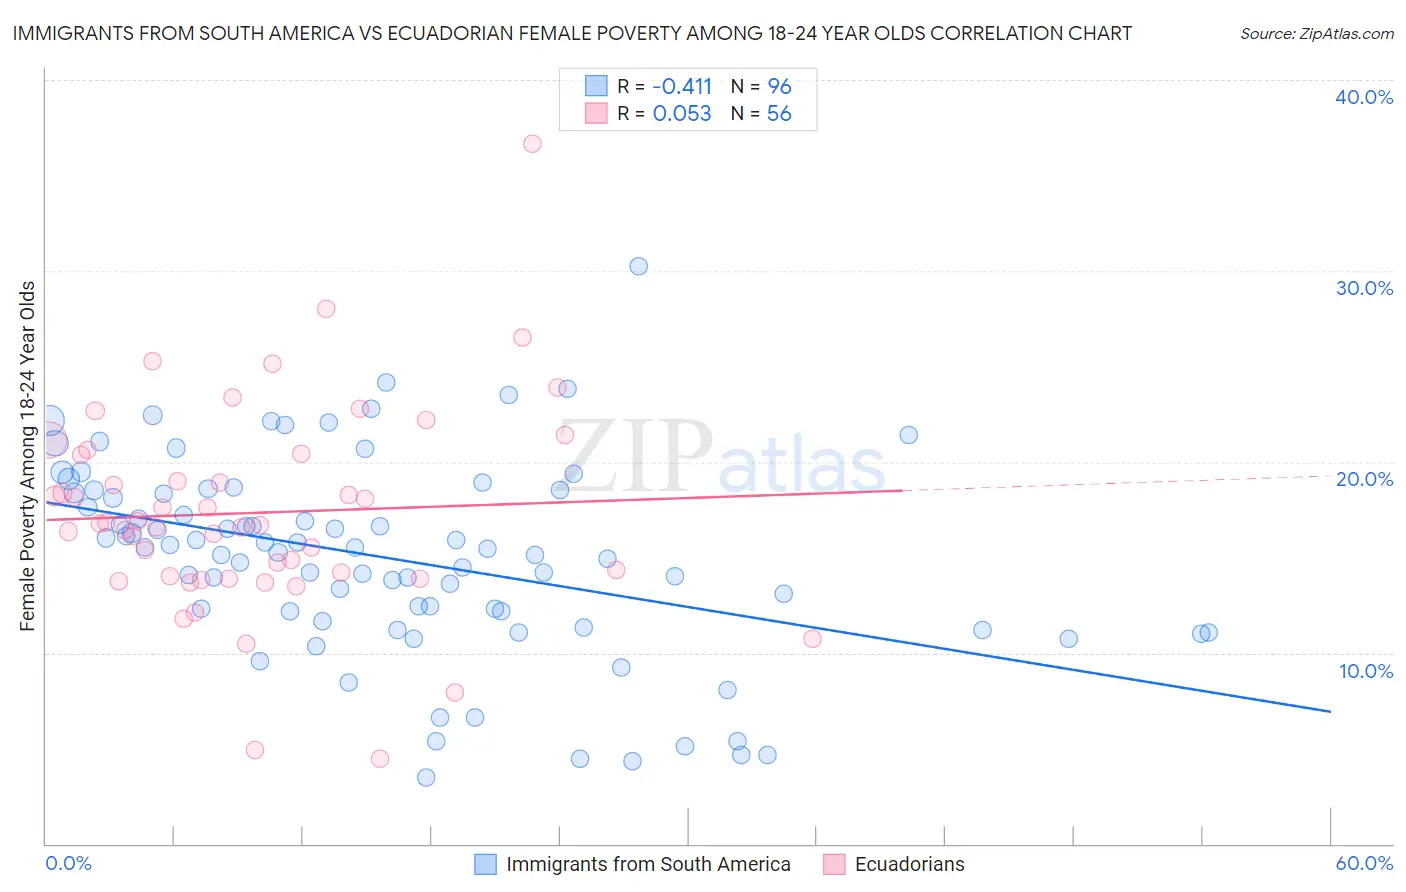
Immigrants from South America vs Ecuadorian Female Poverty Among 18-24 Year Olds Correlation Chart
The statistical analysis conducted on geographies consisting of 468,818,537 people shows a moderate negative correlation between the proportion of Immigrants from South America and poverty level among females between the ages 18 and 24 in the United States with a correlation coefficient (R) of -0.411 and weighted average of 17.9%. Similarly, the statistical analysis conducted on geographies consisting of 311,495,994 people shows a slight positive correlation between the proportion of Ecuadorians and poverty level among females between the ages 18 and 24 in the United States with a correlation coefficient (R) of 0.053 and weighted average of 19.1%, a difference of 6.8%.
Female Poverty Among 18-24 Year Olds Correlation Summary
| Measurement | Immigrants from South America | Ecuadorian |
| Minimum | 3.5% | 4.4% |
| Maximum | 30.2% | 36.6% |
| Range | 26.7% | 32.2% |
| Mean | 15.0% | 17.3% |
| Median | 15.5% | 16.7% |
| Interquartile 25% (IQ1) | 11.9% | 14.0% |
| Interquartile 75% (IQ3) | 18.4% | 20.4% |
| Interquartile Range (IQR) | 6.5% | 6.4% |
| Standard Deviation (Sample) | 5.2% | 5.4% |
| Standard Deviation (Population) | 5.2% | 5.4% |
Similar Demographics by Female Poverty Among 18-24 Year Olds
Demographics Similar to Immigrants from South America by Female Poverty Among 18-24 Year Olds
In terms of female poverty among 18-24 year olds, the demographic groups most similar to Immigrants from South America are Immigrants from Greece (17.9%, a difference of 0.050%), Immigrants from Croatia (17.9%, a difference of 0.060%), Immigrants from Nicaragua (17.9%, a difference of 0.090%), Native Hawaiian (17.9%, a difference of 0.20%), and Immigrants from Moldova (17.9%, a difference of 0.23%).
| Demographics | Rating | Rank | Female Poverty Among 18-24 Year Olds |
| Portuguese | 100.0 /100 | #29 | Exceptional 17.8% |
| Immigrants | South Eastern Asia | 100.0 /100 | #30 | Exceptional 17.8% |
| Immigrants | Vietnam | 100.0 /100 | #31 | Exceptional 17.8% |
| Immigrants | Moldova | 100.0 /100 | #32 | Exceptional 17.9% |
| Native Hawaiians | 100.0 /100 | #33 | Exceptional 17.9% |
| Immigrants | Nicaragua | 100.0 /100 | #34 | Exceptional 17.9% |
| Immigrants | Greece | 100.0 /100 | #35 | Exceptional 17.9% |
| Immigrants | South America | 100.0 /100 | #36 | Exceptional 17.9% |
| Immigrants | Croatia | 100.0 /100 | #37 | Exceptional 17.9% |
| South Americans | 100.0 /100 | #38 | Exceptional 18.0% |
| Puget Sound Salish | 100.0 /100 | #39 | Exceptional 18.0% |
| Immigrants | Romania | 100.0 /100 | #40 | Exceptional 18.0% |
| Immigrants | Argentina | 100.0 /100 | #41 | Exceptional 18.0% |
| Bulgarians | 100.0 /100 | #42 | Exceptional 18.1% |
| Macedonians | 100.0 /100 | #43 | Exceptional 18.1% |
Demographics Similar to Ecuadorians by Female Poverty Among 18-24 Year Olds
In terms of female poverty among 18-24 year olds, the demographic groups most similar to Ecuadorians are Immigrants from Caribbean (19.1%, a difference of 0.020%), Serbian (19.1%, a difference of 0.070%), Chilean (19.1%, a difference of 0.090%), Immigrants from Czechoslovakia (19.1%, a difference of 0.11%), and Immigrants from Afghanistan (19.1%, a difference of 0.11%).
| Demographics | Rating | Rank | Female Poverty Among 18-24 Year Olds |
| Ukrainians | 98.8 /100 | #94 | Exceptional 19.0% |
| Guamanians/Chamorros | 98.8 /100 | #95 | Exceptional 19.0% |
| Sierra Leoneans | 98.7 /100 | #96 | Exceptional 19.0% |
| Salvadorans | 98.4 /100 | #97 | Exceptional 19.1% |
| Immigrants | Jordan | 98.4 /100 | #98 | Exceptional 19.1% |
| Immigrants | Czechoslovakia | 98.3 /100 | #99 | Exceptional 19.1% |
| Chileans | 98.3 /100 | #100 | Exceptional 19.1% |
| Ecuadorians | 98.1 /100 | #101 | Exceptional 19.1% |
| Immigrants | Caribbean | 98.1 /100 | #102 | Exceptional 19.1% |
| Serbians | 98.0 /100 | #103 | Exceptional 19.1% |
| Immigrants | Afghanistan | 98.0 /100 | #104 | Exceptional 19.1% |
| Immigrants | Ecuador | 97.8 /100 | #105 | Exceptional 19.2% |
| Immigrants | Sierra Leone | 97.8 /100 | #106 | Exceptional 19.2% |
| Immigrants | Sri Lanka | 97.5 /100 | #107 | Exceptional 19.2% |
| Immigrants | Uzbekistan | 97.3 /100 | #108 | Exceptional 19.2% |