Colombian vs Immigrants from Romania Female Poverty Among 18-24 Year Olds
COMPARE
Colombian
Immigrants from Romania
Female Poverty Among 18-24 Year Olds
Female Poverty Among 18-24 Year Olds Comparison
Colombians
Immigrants from Romania
17.7%
FEMALE POVERTY AMONG 18-24 YEAR OLDS
100.0/ 100
METRIC RATING
27th/ 347
METRIC RANK
18.0%
FEMALE POVERTY AMONG 18-24 YEAR OLDS
100.0/ 100
METRIC RATING
40th/ 347
METRIC RANK
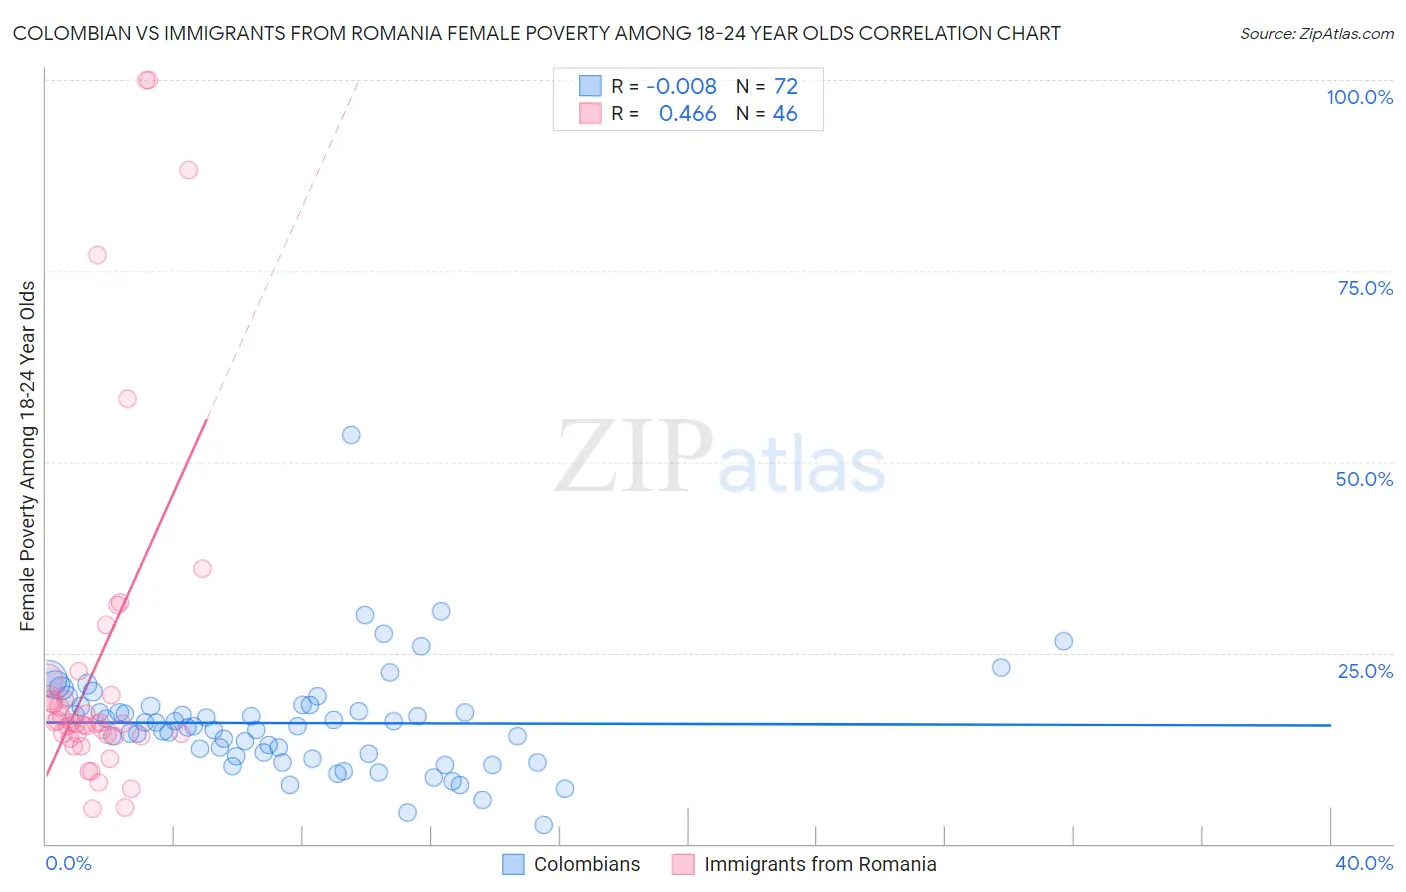
Colombian vs Immigrants from Romania Female Poverty Among 18-24 Year Olds Correlation Chart
The statistical analysis conducted on geographies consisting of 408,743,198 people shows no correlation between the proportion of Colombians and poverty level among females between the ages 18 and 24 in the United States with a correlation coefficient (R) of -0.008 and weighted average of 17.7%. Similarly, the statistical analysis conducted on geographies consisting of 252,362,206 people shows a moderate positive correlation between the proportion of Immigrants from Romania and poverty level among females between the ages 18 and 24 in the United States with a correlation coefficient (R) of 0.466 and weighted average of 18.0%, a difference of 1.8%.
Female Poverty Among 18-24 Year Olds Correlation Summary
| Measurement | Colombian | Immigrants from Romania |
| Minimum | 2.5% | 4.6% |
| Maximum | 53.6% | 100.0% |
| Range | 51.0% | 95.4% |
| Mean | 15.8% | 23.8% |
| Median | 15.4% | 15.8% |
| Interquartile 25% (IQ1) | 11.6% | 14.1% |
| Interquartile 75% (IQ3) | 18.0% | 19.5% |
| Interquartile Range (IQR) | 6.4% | 5.4% |
| Standard Deviation (Sample) | 7.1% | 23.0% |
| Standard Deviation (Population) | 7.1% | 22.7% |
Demographics Similar to Colombians and Immigrants from Romania by Female Poverty Among 18-24 Year Olds
In terms of female poverty among 18-24 year olds, the demographic groups most similar to Colombians are Immigrants from Fiji (17.7%, a difference of 0.11%), Venezuelan (17.7%, a difference of 0.14%), Immigrants from South Central Asia (17.6%, a difference of 0.43%), Portuguese (17.8%, a difference of 0.47%), and Maltese (17.6%, a difference of 0.61%). Similarly, the demographic groups most similar to Immigrants from Romania are Immigrants from Argentina (18.0%, a difference of 0.010%), Puget Sound Salish (18.0%, a difference of 0.030%), South American (18.0%, a difference of 0.24%), Immigrants from Croatia (17.9%, a difference of 0.46%), and Bulgarian (18.1%, a difference of 0.48%).
| Demographics | Rating | Rank | Female Poverty Among 18-24 Year Olds |
| Immigrants | North Macedonia | 100.0 /100 | #23 | Exceptional 17.6% |
| Maltese | 100.0 /100 | #24 | Exceptional 17.6% |
| Immigrants | South Central Asia | 100.0 /100 | #25 | Exceptional 17.6% |
| Immigrants | Fiji | 100.0 /100 | #26 | Exceptional 17.7% |
| Colombians | 100.0 /100 | #27 | Exceptional 17.7% |
| Venezuelans | 100.0 /100 | #28 | Exceptional 17.7% |
| Portuguese | 100.0 /100 | #29 | Exceptional 17.8% |
| Immigrants | South Eastern Asia | 100.0 /100 | #30 | Exceptional 17.8% |
| Immigrants | Vietnam | 100.0 /100 | #31 | Exceptional 17.8% |
| Immigrants | Moldova | 100.0 /100 | #32 | Exceptional 17.9% |
| Native Hawaiians | 100.0 /100 | #33 | Exceptional 17.9% |
| Immigrants | Nicaragua | 100.0 /100 | #34 | Exceptional 17.9% |
| Immigrants | Greece | 100.0 /100 | #35 | Exceptional 17.9% |
| Immigrants | South America | 100.0 /100 | #36 | Exceptional 17.9% |
| Immigrants | Croatia | 100.0 /100 | #37 | Exceptional 17.9% |
| South Americans | 100.0 /100 | #38 | Exceptional 18.0% |
| Puget Sound Salish | 100.0 /100 | #39 | Exceptional 18.0% |
| Immigrants | Romania | 100.0 /100 | #40 | Exceptional 18.0% |
| Immigrants | Argentina | 100.0 /100 | #41 | Exceptional 18.0% |
| Bulgarians | 100.0 /100 | #42 | Exceptional 18.1% |
| Macedonians | 100.0 /100 | #43 | Exceptional 18.1% |