Choctaw vs Jordanian Single Mother Households
COMPARE
Choctaw
Jordanian
Single Mother Households
Single Mother Households Comparison
Choctaw
Jordanians
7.0%
SINGLE MOTHER HOUSEHOLDS
1.4/ 100
METRIC RATING
233rd/ 347
METRIC RANK
6.0%
SINGLE MOTHER HOUSEHOLDS
88.9/ 100
METRIC RATING
136th/ 347
METRIC RANK
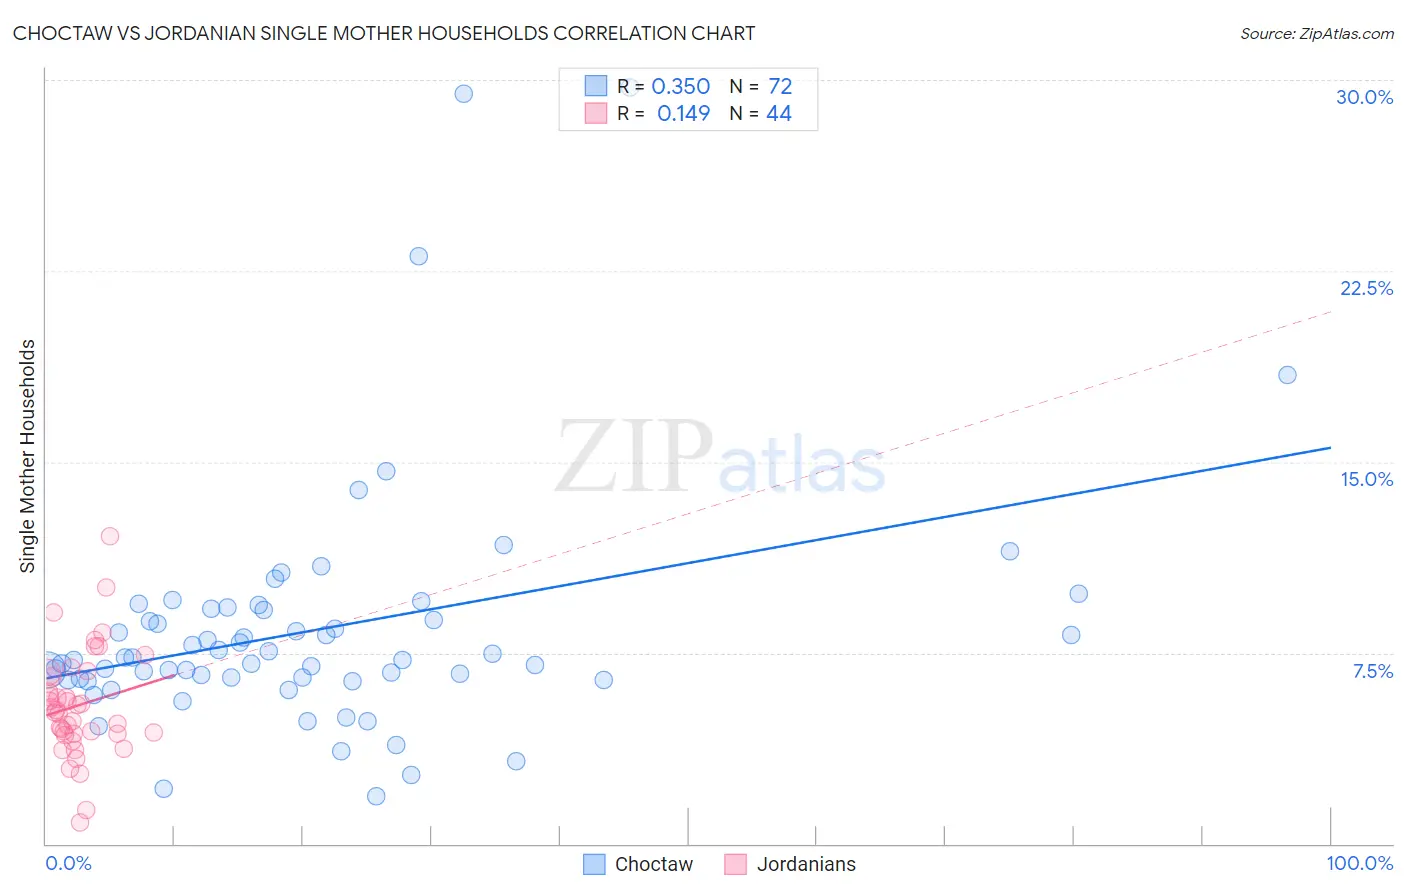
Choctaw vs Jordanian Single Mother Households Correlation Chart
The statistical analysis conducted on geographies consisting of 269,186,526 people shows a mild positive correlation between the proportion of Choctaw and percentage of single mother households in the United States with a correlation coefficient (R) of 0.350 and weighted average of 7.0%. Similarly, the statistical analysis conducted on geographies consisting of 166,276,124 people shows a poor positive correlation between the proportion of Jordanians and percentage of single mother households in the United States with a correlation coefficient (R) of 0.149 and weighted average of 6.0%, a difference of 18.3%.
Single Mother Households Correlation Summary
| Measurement | Choctaw | Jordanian |
| Minimum | 1.9% | 0.84% |
| Maximum | 29.7% | 12.1% |
| Range | 27.9% | 11.2% |
| Mean | 8.4% | 5.4% |
| Median | 7.3% | 5.2% |
| Interquartile 25% (IQ1) | 6.5% | 4.3% |
| Interquartile 75% (IQ3) | 9.2% | 6.6% |
| Interquartile Range (IQR) | 2.8% | 2.3% |
| Standard Deviation (Sample) | 4.8% | 2.1% |
| Standard Deviation (Population) | 4.8% | 2.1% |
Similar Demographics by Single Mother Households
Demographics Similar to Choctaw by Single Mother Households
In terms of single mother households, the demographic groups most similar to Choctaw are Chickasaw (7.0%, a difference of 0.020%), Immigrants from Burma/Myanmar (7.0%, a difference of 0.090%), Comanche (7.0%, a difference of 0.17%), Spanish American (7.0%, a difference of 0.23%), and Creek (7.0%, a difference of 0.25%).
| Demographics | Rating | Rank | Single Mother Households |
| Paiute | 2.4 /100 | #226 | Tragic 7.0% |
| Kenyans | 2.3 /100 | #227 | Tragic 7.0% |
| Iroquois | 2.2 /100 | #228 | Tragic 7.0% |
| Immigrants | Kenya | 2.1 /100 | #229 | Tragic 7.0% |
| Creek | 1.6 /100 | #230 | Tragic 7.0% |
| Spanish Americans | 1.6 /100 | #231 | Tragic 7.0% |
| Comanche | 1.5 /100 | #232 | Tragic 7.0% |
| Choctaw | 1.4 /100 | #233 | Tragic 7.0% |
| Chickasaw | 1.4 /100 | #234 | Tragic 7.0% |
| Immigrants | Burma/Myanmar | 1.4 /100 | #235 | Tragic 7.0% |
| Ute | 1.0 /100 | #236 | Tragic 7.1% |
| Arapaho | 1.0 /100 | #237 | Tragic 7.1% |
| Panamanians | 0.9 /100 | #238 | Tragic 7.1% |
| Kiowa | 0.8 /100 | #239 | Tragic 7.1% |
| Immigrants | Panama | 0.7 /100 | #240 | Tragic 7.2% |
Demographics Similar to Jordanians by Single Mother Households
In terms of single mother households, the demographic groups most similar to Jordanians are Immigrants from Pakistan (6.0%, a difference of 0.13%), Immigrants from Saudi Arabia (5.9%, a difference of 0.42%), Canadian (5.9%, a difference of 0.51%), Icelander (6.0%, a difference of 0.53%), and Egyptian (5.9%, a difference of 0.57%).
| Demographics | Rating | Rank | Single Mother Households |
| Immigrants | Bolivia | 92.2 /100 | #129 | Exceptional 5.9% |
| Palestinians | 92.1 /100 | #130 | Exceptional 5.9% |
| Immigrants | Spain | 91.2 /100 | #131 | Exceptional 5.9% |
| Albanians | 91.1 /100 | #132 | Exceptional 5.9% |
| Egyptians | 90.7 /100 | #133 | Exceptional 5.9% |
| Canadians | 90.5 /100 | #134 | Exceptional 5.9% |
| Immigrants | Saudi Arabia | 90.2 /100 | #135 | Exceptional 5.9% |
| Jordanians | 88.9 /100 | #136 | Excellent 6.0% |
| Immigrants | Pakistan | 88.4 /100 | #137 | Excellent 6.0% |
| Icelanders | 86.9 /100 | #138 | Excellent 6.0% |
| Syrians | 86.0 /100 | #139 | Excellent 6.0% |
| French | 85.7 /100 | #140 | Excellent 6.0% |
| Tsimshian | 85.2 /100 | #141 | Excellent 6.0% |
| Immigrants | Egypt | 85.0 /100 | #142 | Excellent 6.0% |
| Immigrants | Iraq | 84.8 /100 | #143 | Excellent 6.0% |