Choctaw vs Immigrants from Syria Family Poverty
COMPARE
Choctaw
Immigrants from Syria
Family Poverty
Family Poverty Comparison
Choctaw
Immigrants from Syria
11.6%
FAMILY POVERTY
0.0/ 100
METRIC RATING
296th/ 347
METRIC RANK
9.0%
FAMILY POVERTY
47.5/ 100
METRIC RATING
176th/ 347
METRIC RANK
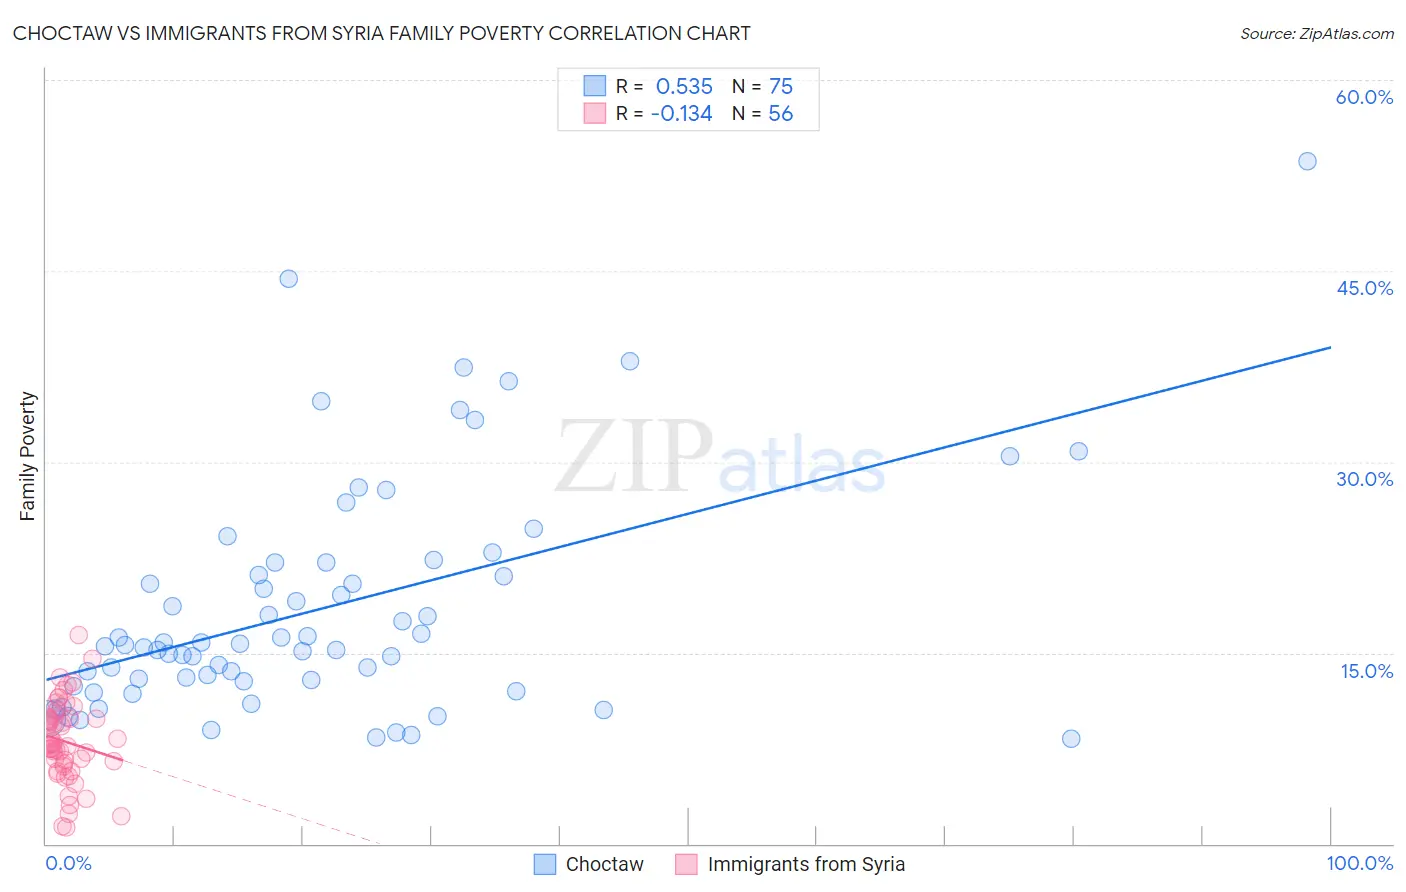
Choctaw vs Immigrants from Syria Family Poverty Correlation Chart
The statistical analysis conducted on geographies consisting of 269,406,006 people shows a substantial positive correlation between the proportion of Choctaw and poverty level among families in the United States with a correlation coefficient (R) of 0.535 and weighted average of 11.6%. Similarly, the statistical analysis conducted on geographies consisting of 173,889,011 people shows a poor negative correlation between the proportion of Immigrants from Syria and poverty level among families in the United States with a correlation coefficient (R) of -0.134 and weighted average of 9.0%, a difference of 28.6%.
Family Poverty Correlation Summary
| Measurement | Choctaw | Immigrants from Syria |
| Minimum | 8.2% | 1.2% |
| Maximum | 53.6% | 16.4% |
| Range | 45.4% | 15.2% |
| Mean | 18.5% | 8.0% |
| Median | 15.6% | 7.7% |
| Interquartile 25% (IQ1) | 12.7% | 6.2% |
| Interquartile 75% (IQ3) | 22.1% | 9.8% |
| Interquartile Range (IQR) | 9.3% | 3.7% |
| Standard Deviation (Sample) | 9.0% | 3.2% |
| Standard Deviation (Population) | 9.0% | 3.2% |
Similar Demographics by Family Poverty
Demographics Similar to Choctaw by Family Poverty
In terms of family poverty, the demographic groups most similar to Choctaw are Immigrants from Haiti (11.6%, a difference of 0.050%), Immigrants from St. Vincent and the Grenadines (11.6%, a difference of 0.17%), Creek (11.7%, a difference of 0.23%), Immigrants from Cabo Verde (11.6%, a difference of 0.25%), and Immigrants from Senegal (11.7%, a difference of 0.37%).
| Demographics | Rating | Rank | Family Poverty |
| Immigrants | Barbados | 0.0 /100 | #289 | Tragic 11.5% |
| West Indians | 0.0 /100 | #290 | Tragic 11.5% |
| Haitians | 0.0 /100 | #291 | Tragic 11.5% |
| Immigrants | Somalia | 0.0 /100 | #292 | Tragic 11.5% |
| Immigrants | Cabo Verde | 0.0 /100 | #293 | Tragic 11.6% |
| Immigrants | St. Vincent and the Grenadines | 0.0 /100 | #294 | Tragic 11.6% |
| Immigrants | Haiti | 0.0 /100 | #295 | Tragic 11.6% |
| Choctaw | 0.0 /100 | #296 | Tragic 11.6% |
| Creek | 0.0 /100 | #297 | Tragic 11.7% |
| Immigrants | Senegal | 0.0 /100 | #298 | Tragic 11.7% |
| Dutch West Indians | 0.0 /100 | #299 | Tragic 11.7% |
| Immigrants | Bangladesh | 0.0 /100 | #300 | Tragic 11.7% |
| Bahamians | 0.0 /100 | #301 | Tragic 11.7% |
| Guatemalans | 0.0 /100 | #302 | Tragic 11.7% |
| Africans | 0.0 /100 | #303 | Tragic 11.8% |
Demographics Similar to Immigrants from Syria by Family Poverty
In terms of family poverty, the demographic groups most similar to Immigrants from Syria are Hawaiian (9.0%, a difference of 0.030%), Immigrants from Cameroon (9.0%, a difference of 0.040%), Costa Rican (9.0%, a difference of 0.24%), Immigrants from Albania (9.0%, a difference of 0.33%), and Immigrants from Iraq (9.1%, a difference of 0.41%).
| Demographics | Rating | Rank | Family Poverty |
| Immigrants | Chile | 59.6 /100 | #169 | Average 8.9% |
| Kenyans | 58.2 /100 | #170 | Average 8.9% |
| Lebanese | 57.6 /100 | #171 | Average 8.9% |
| Immigrants | Peru | 57.5 /100 | #172 | Average 8.9% |
| Immigrants | Fiji | 56.4 /100 | #173 | Average 8.9% |
| Immigrants | Albania | 50.0 /100 | #174 | Average 9.0% |
| Costa Ricans | 49.3 /100 | #175 | Average 9.0% |
| Immigrants | Syria | 47.5 /100 | #176 | Average 9.0% |
| Hawaiians | 47.2 /100 | #177 | Average 9.0% |
| Immigrants | Cameroon | 47.1 /100 | #178 | Average 9.0% |
| Immigrants | Iraq | 44.4 /100 | #179 | Average 9.1% |
| Immigrants | Uganda | 43.4 /100 | #180 | Average 9.1% |
| Hmong | 40.2 /100 | #181 | Average 9.1% |
| Immigrants | Morocco | 40.2 /100 | #182 | Average 9.1% |
| Uruguayans | 39.2 /100 | #183 | Fair 9.1% |