Choctaw vs Central American Family Poverty
COMPARE
Choctaw
Central American
Family Poverty
Family Poverty Comparison
Choctaw
Central Americans
11.6%
FAMILY POVERTY
0.0/ 100
METRIC RATING
296th/ 347
METRIC RANK
11.2%
FAMILY POVERTY
0.1/ 100
METRIC RATING
275th/ 347
METRIC RANK
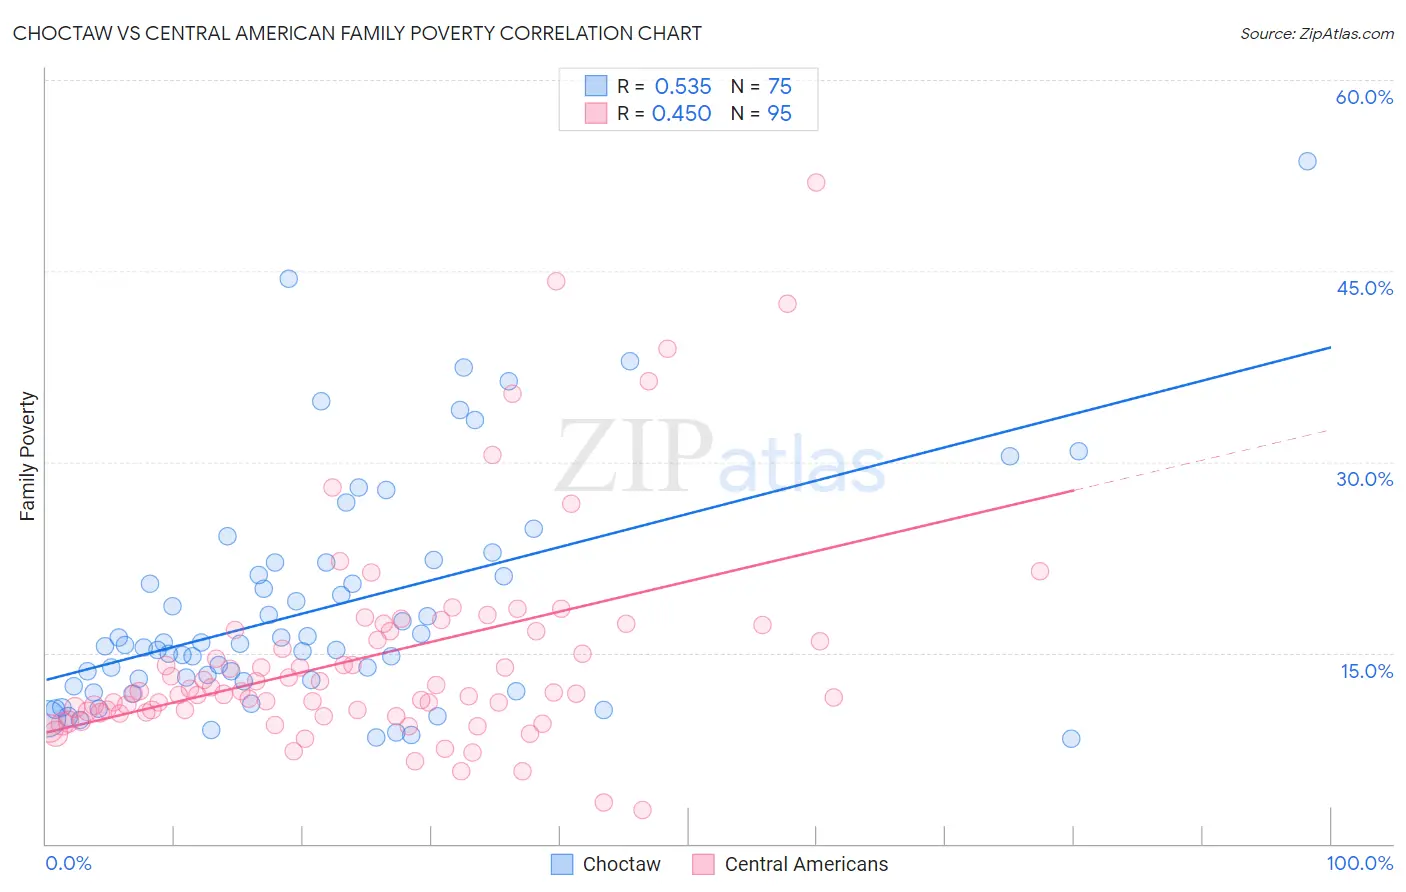
Choctaw vs Central American Family Poverty Correlation Chart
The statistical analysis conducted on geographies consisting of 269,406,006 people shows a substantial positive correlation between the proportion of Choctaw and poverty level among families in the United States with a correlation coefficient (R) of 0.535 and weighted average of 11.6%. Similarly, the statistical analysis conducted on geographies consisting of 502,607,285 people shows a moderate positive correlation between the proportion of Central Americans and poverty level among families in the United States with a correlation coefficient (R) of 0.450 and weighted average of 11.2%, a difference of 3.6%.
Family Poverty Correlation Summary
| Measurement | Choctaw | Central American |
| Minimum | 8.2% | 2.6% |
| Maximum | 53.6% | 51.9% |
| Range | 45.4% | 49.3% |
| Mean | 18.5% | 14.7% |
| Median | 15.6% | 11.8% |
| Interquartile 25% (IQ1) | 12.7% | 10.3% |
| Interquartile 75% (IQ3) | 22.1% | 16.7% |
| Interquartile Range (IQR) | 9.3% | 6.4% |
| Standard Deviation (Sample) | 9.0% | 8.5% |
| Standard Deviation (Population) | 9.0% | 8.5% |
Similar Demographics by Family Poverty
Demographics Similar to Choctaw by Family Poverty
In terms of family poverty, the demographic groups most similar to Choctaw are Immigrants from Haiti (11.6%, a difference of 0.050%), Immigrants from St. Vincent and the Grenadines (11.6%, a difference of 0.17%), Creek (11.7%, a difference of 0.23%), Immigrants from Cabo Verde (11.6%, a difference of 0.25%), and Immigrants from Senegal (11.7%, a difference of 0.37%).
| Demographics | Rating | Rank | Family Poverty |
| Immigrants | Barbados | 0.0 /100 | #289 | Tragic 11.5% |
| West Indians | 0.0 /100 | #290 | Tragic 11.5% |
| Haitians | 0.0 /100 | #291 | Tragic 11.5% |
| Immigrants | Somalia | 0.0 /100 | #292 | Tragic 11.5% |
| Immigrants | Cabo Verde | 0.0 /100 | #293 | Tragic 11.6% |
| Immigrants | St. Vincent and the Grenadines | 0.0 /100 | #294 | Tragic 11.6% |
| Immigrants | Haiti | 0.0 /100 | #295 | Tragic 11.6% |
| Choctaw | 0.0 /100 | #296 | Tragic 11.6% |
| Creek | 0.0 /100 | #297 | Tragic 11.7% |
| Immigrants | Senegal | 0.0 /100 | #298 | Tragic 11.7% |
| Dutch West Indians | 0.0 /100 | #299 | Tragic 11.7% |
| Immigrants | Bangladesh | 0.0 /100 | #300 | Tragic 11.7% |
| Bahamians | 0.0 /100 | #301 | Tragic 11.7% |
| Guatemalans | 0.0 /100 | #302 | Tragic 11.7% |
| Africans | 0.0 /100 | #303 | Tragic 11.8% |
Demographics Similar to Central Americans by Family Poverty
In terms of family poverty, the demographic groups most similar to Central Americans are Immigrants from Guyana (11.2%, a difference of 0.020%), Spanish American (11.2%, a difference of 0.050%), Chippewa (11.2%, a difference of 0.11%), Somali (11.2%, a difference of 0.13%), and Guyanese (11.2%, a difference of 0.14%).
| Demographics | Rating | Rank | Family Poverty |
| Jamaicans | 0.1 /100 | #268 | Tragic 11.1% |
| Immigrants | Ecuador | 0.1 /100 | #269 | Tragic 11.1% |
| Immigrants | Nicaragua | 0.1 /100 | #270 | Tragic 11.1% |
| Immigrants | Bahamas | 0.1 /100 | #271 | Tragic 11.1% |
| Immigrants | Jamaica | 0.1 /100 | #272 | Tragic 11.2% |
| Somalis | 0.1 /100 | #273 | Tragic 11.2% |
| Spanish Americans | 0.1 /100 | #274 | Tragic 11.2% |
| Central Americans | 0.1 /100 | #275 | Tragic 11.2% |
| Immigrants | Guyana | 0.1 /100 | #276 | Tragic 11.2% |
| Chippewa | 0.1 /100 | #277 | Tragic 11.2% |
| Guyanese | 0.1 /100 | #278 | Tragic 11.2% |
| Blackfeet | 0.0 /100 | #279 | Tragic 11.3% |
| Belizeans | 0.0 /100 | #280 | Tragic 11.3% |
| Immigrants | West Indies | 0.0 /100 | #281 | Tragic 11.3% |
| Immigrants | Cuba | 0.0 /100 | #282 | Tragic 11.3% |