Choctaw vs Assyrian/Chaldean/Syriac Unemployment Among Ages 65 to 74 years
COMPARE
Choctaw
Assyrian/Chaldean/Syriac
Unemployment Among Ages 65 to 74 years
Unemployment Among Ages 65 to 74 years Comparison
Choctaw
Assyrians/Chaldeans/Syriacs
5.1%
UNEMPLOYMENT AMONG AGES 65 TO 74 YEARS
99.8/ 100
METRIC RATING
48th/ 347
METRIC RANK
5.1%
UNEMPLOYMENT AMONG AGES 65 TO 74 YEARS
99.9/ 100
METRIC RATING
43rd/ 347
METRIC RANK
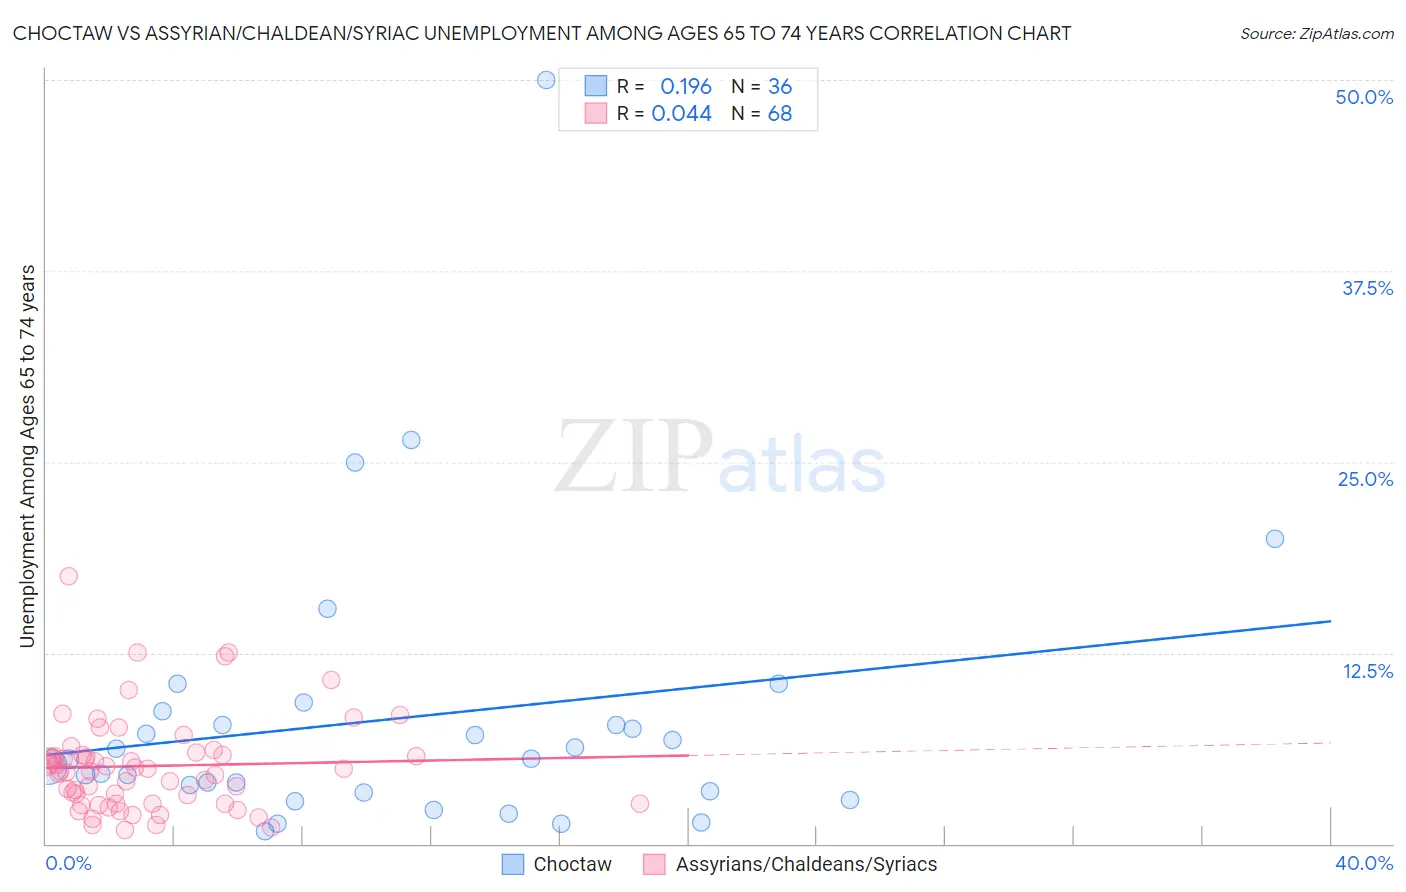
Choctaw vs Assyrian/Chaldean/Syriac Unemployment Among Ages 65 to 74 years Correlation Chart
The statistical analysis conducted on geographies consisting of 239,014,089 people shows a poor positive correlation between the proportion of Choctaw and unemployment rate among population between the ages 65 and 74 in the United States with a correlation coefficient (R) of 0.196 and weighted average of 5.1%. Similarly, the statistical analysis conducted on geographies consisting of 106,069,600 people shows no correlation between the proportion of Assyrians/Chaldeans/Syriacs and unemployment rate among population between the ages 65 and 74 in the United States with a correlation coefficient (R) of 0.044 and weighted average of 5.1%, a difference of 0.55%.
Unemployment Among Ages 65 to 74 years Correlation Summary
| Measurement | Choctaw | Assyrian/Chaldean/Syriac |
| Minimum | 0.86% | 0.90% |
| Maximum | 50.0% | 17.5% |
| Range | 49.1% | 16.6% |
| Mean | 8.2% | 5.1% |
| Median | 5.5% | 4.8% |
| Interquartile 25% (IQ1) | 3.4% | 2.6% |
| Interquartile 75% (IQ3) | 8.2% | 5.8% |
| Interquartile Range (IQR) | 4.9% | 3.2% |
| Standard Deviation (Sample) | 9.4% | 3.1% |
| Standard Deviation (Population) | 9.2% | 3.1% |
Demographics Similar to Choctaw and Assyrians/Chaldeans/Syriacs by Unemployment Among Ages 65 to 74 years
In terms of unemployment among ages 65 to 74 years, the demographic groups most similar to Choctaw are Immigrants from Austria (5.1%, a difference of 0.010%), Immigrants from Uganda (5.1%, a difference of 0.16%), Immigrants from Zimbabwe (5.1%, a difference of 0.18%), Immigrants from Kazakhstan (5.1%, a difference of 0.20%), and Immigrants from Kenya (5.1%, a difference of 0.21%). Similarly, the demographic groups most similar to Assyrians/Chaldeans/Syriacs are Immigrants from India (5.1%, a difference of 0.090%), Jordanian (5.1%, a difference of 0.12%), Sioux (5.1%, a difference of 0.20%), Ugandan (5.1%, a difference of 0.27%), and Immigrants from Iraq (5.1%, a difference of 0.28%).
| Demographics | Rating | Rank | Unemployment Among Ages 65 to 74 years |
| Bhutanese | 100.0 /100 | #35 | Exceptional 5.0% |
| Immigrants | Kuwait | 99.9 /100 | #36 | Exceptional 5.0% |
| Immigrants | Eastern Africa | 99.9 /100 | #37 | Exceptional 5.0% |
| Nepalese | 99.9 /100 | #38 | Exceptional 5.0% |
| Immigrants | Sweden | 99.9 /100 | #39 | Exceptional 5.0% |
| Immigrants | Iraq | 99.9 /100 | #40 | Exceptional 5.1% |
| Ugandans | 99.9 /100 | #41 | Exceptional 5.1% |
| Jordanians | 99.9 /100 | #42 | Exceptional 5.1% |
| Assyrians/Chaldeans/Syriacs | 99.9 /100 | #43 | Exceptional 5.1% |
| Immigrants | India | 99.9 /100 | #44 | Exceptional 5.1% |
| Sioux | 99.8 /100 | #45 | Exceptional 5.1% |
| Immigrants | Kenya | 99.8 /100 | #46 | Exceptional 5.1% |
| Immigrants | Uganda | 99.8 /100 | #47 | Exceptional 5.1% |
| Choctaw | 99.8 /100 | #48 | Exceptional 5.1% |
| Immigrants | Austria | 99.8 /100 | #49 | Exceptional 5.1% |
| Immigrants | Zimbabwe | 99.7 /100 | #50 | Exceptional 5.1% |
| Immigrants | Kazakhstan | 99.7 /100 | #51 | Exceptional 5.1% |
| Europeans | 99.6 /100 | #52 | Exceptional 5.1% |
| Immigrants | Ethiopia | 99.6 /100 | #53 | Exceptional 5.1% |
| Immigrants | Nicaragua | 99.6 /100 | #54 | Exceptional 5.1% |
| Carpatho Rusyns | 99.6 /100 | #55 | Exceptional 5.1% |