Immigrants from Vietnam vs Puget Sound Salish Female Poverty
COMPARE
Immigrants from Vietnam
Puget Sound Salish
Female Poverty
Female Poverty Comparison
Immigrants from Vietnam
Puget Sound Salish
12.8%
FEMALE POVERTY
87.1/ 100
METRIC RATING
130th/ 347
METRIC RANK
12.7%
FEMALE POVERTY
91.5/ 100
METRIC RATING
115th/ 347
METRIC RANK
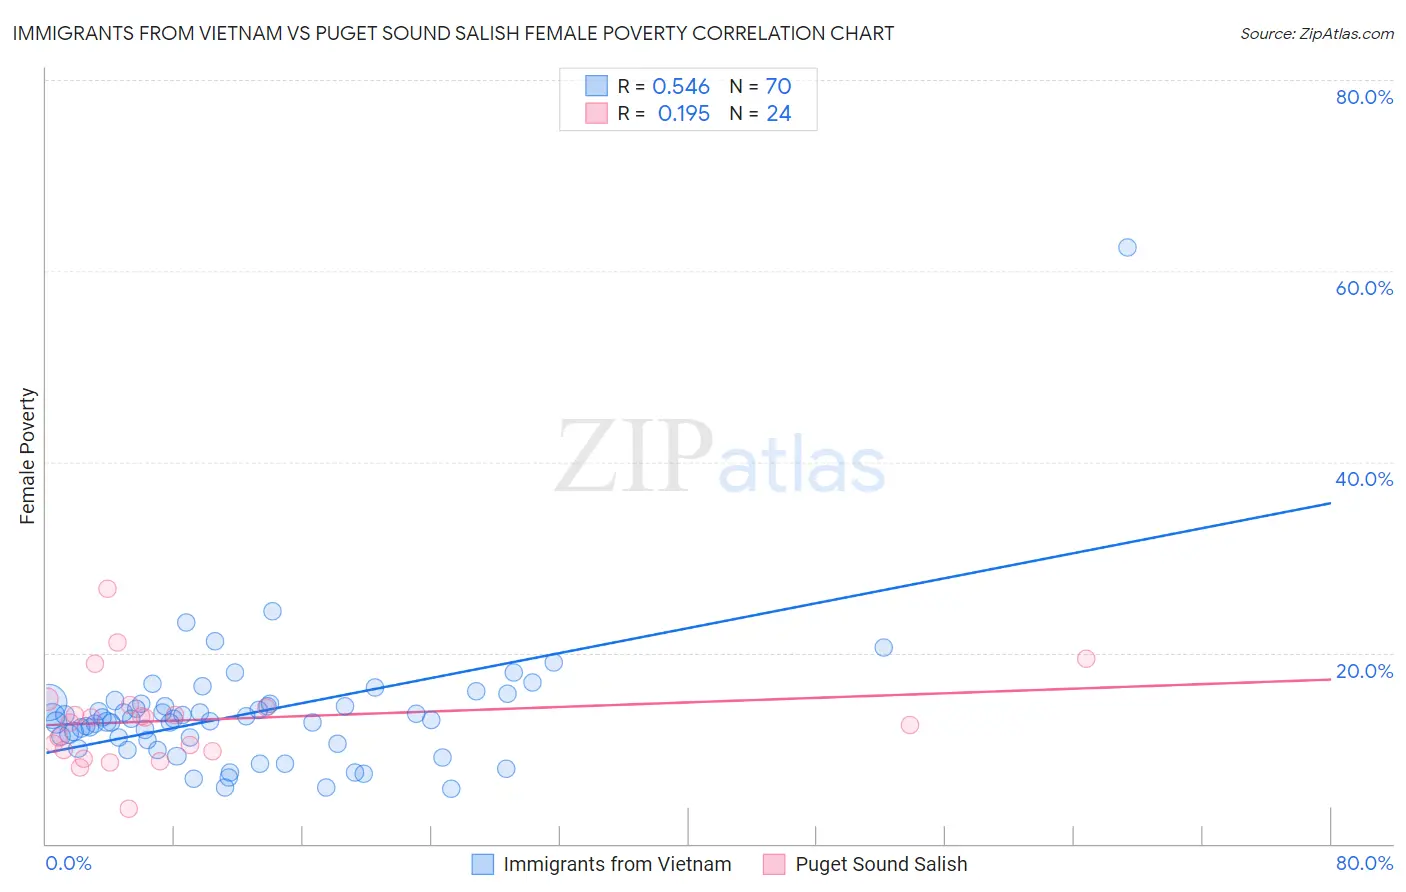
Immigrants from Vietnam vs Puget Sound Salish Female Poverty Correlation Chart
The statistical analysis conducted on geographies consisting of 404,524,088 people shows a substantial positive correlation between the proportion of Immigrants from Vietnam and poverty level among females in the United States with a correlation coefficient (R) of 0.546 and weighted average of 12.8%. Similarly, the statistical analysis conducted on geographies consisting of 46,146,424 people shows a poor positive correlation between the proportion of Puget Sound Salish and poverty level among females in the United States with a correlation coefficient (R) of 0.195 and weighted average of 12.7%, a difference of 1.2%.
Female Poverty Correlation Summary
| Measurement | Immigrants from Vietnam | Puget Sound Salish |
| Minimum | 5.8% | 3.6% |
| Maximum | 62.5% | 26.7% |
| Range | 56.7% | 23.1% |
| Mean | 13.6% | 13.0% |
| Median | 13.0% | 13.0% |
| Interquartile 25% (IQ1) | 10.8% | 9.8% |
| Interquartile 75% (IQ3) | 14.6% | 14.4% |
| Interquartile Range (IQR) | 3.8% | 4.7% |
| Standard Deviation (Sample) | 7.1% | 4.9% |
| Standard Deviation (Population) | 7.0% | 4.8% |
Demographics Similar to Immigrants from Vietnam and Puget Sound Salish by Female Poverty
In terms of female poverty, the demographic groups most similar to Immigrants from Vietnam are Immigrants from Argentina (12.8%, a difference of 0.030%), Immigrants from Jordan (12.8%, a difference of 0.050%), Immigrants from Brazil (12.8%, a difference of 0.19%), Immigrants from Belarus (12.8%, a difference of 0.27%), and South African (12.8%, a difference of 0.30%). Similarly, the demographic groups most similar to Puget Sound Salish are Welsh (12.7%, a difference of 0.020%), Immigrants from Russia (12.7%, a difference of 0.12%), Canadian (12.7%, a difference of 0.14%), Immigrants from Israel (12.6%, a difference of 0.17%), and Immigrants from Southern Europe (12.7%, a difference of 0.20%).
| Demographics | Rating | Rank | Female Poverty |
| Immigrants | Israel | 92.0 /100 | #112 | Exceptional 12.6% |
| Canadians | 92.0 /100 | #113 | Exceptional 12.7% |
| Welsh | 91.6 /100 | #114 | Exceptional 12.7% |
| Puget Sound Salish | 91.5 /100 | #115 | Exceptional 12.7% |
| Immigrants | Russia | 91.2 /100 | #116 | Exceptional 12.7% |
| Immigrants | Southern Europe | 90.9 /100 | #117 | Exceptional 12.7% |
| Sri Lankans | 90.9 /100 | #118 | Exceptional 12.7% |
| Albanians | 90.8 /100 | #119 | Exceptional 12.7% |
| New Zealanders | 90.6 /100 | #120 | Exceptional 12.7% |
| Immigrants | Hungary | 90.3 /100 | #121 | Exceptional 12.7% |
| French Canadians | 90.2 /100 | #122 | Exceptional 12.7% |
| Immigrants | South Eastern Asia | 89.9 /100 | #123 | Excellent 12.7% |
| Immigrants | Norway | 89.3 /100 | #124 | Excellent 12.8% |
| Argentineans | 89.1 /100 | #125 | Excellent 12.8% |
| Immigrants | Ukraine | 88.8 /100 | #126 | Excellent 12.8% |
| South Africans | 88.4 /100 | #127 | Excellent 12.8% |
| Immigrants | Belarus | 88.2 /100 | #128 | Excellent 12.8% |
| Immigrants | Brazil | 87.9 /100 | #129 | Excellent 12.8% |
| Immigrants | Vietnam | 87.1 /100 | #130 | Excellent 12.8% |
| Immigrants | Argentina | 87.0 /100 | #131 | Excellent 12.8% |
| Immigrants | Jordan | 86.9 /100 | #132 | Excellent 12.8% |