Chinese vs Spanish American Male Poverty
COMPARE
Chinese
Spanish American
Male Poverty
Male Poverty Comparison
Chinese
Spanish Americans
8.7%
MALE POVERTY
100.0/ 100
METRIC RATING
2nd/ 347
METRIC RANK
13.4%
MALE POVERTY
0.0/ 100
METRIC RATING
271st/ 347
METRIC RANK
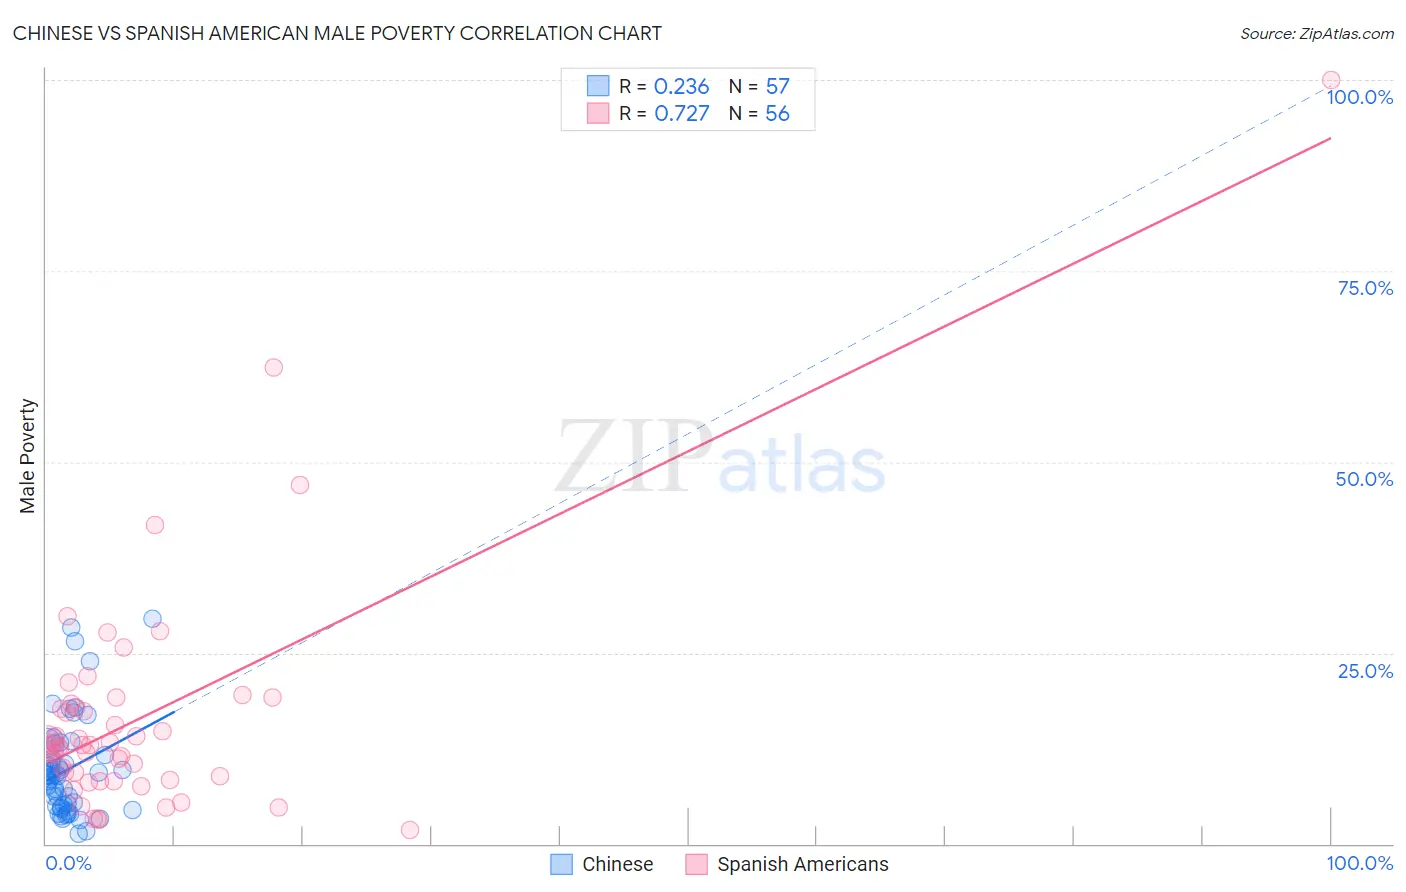
Chinese vs Spanish American Male Poverty Correlation Chart
The statistical analysis conducted on geographies consisting of 64,801,112 people shows a weak positive correlation between the proportion of Chinese and poverty level among males in the United States with a correlation coefficient (R) of 0.236 and weighted average of 8.7%. Similarly, the statistical analysis conducted on geographies consisting of 103,163,136 people shows a strong positive correlation between the proportion of Spanish Americans and poverty level among males in the United States with a correlation coefficient (R) of 0.727 and weighted average of 13.4%, a difference of 53.7%.
Male Poverty Correlation Summary
| Measurement | Chinese | Spanish American |
| Minimum | 1.3% | 1.7% |
| Maximum | 29.4% | 100.0% |
| Range | 28.2% | 98.3% |
| Mean | 9.7% | 16.5% |
| Median | 8.9% | 13.0% |
| Interquartile 25% (IQ1) | 4.8% | 8.6% |
| Interquartile 75% (IQ3) | 12.4% | 18.0% |
| Interquartile Range (IQR) | 7.6% | 9.4% |
| Standard Deviation (Sample) | 6.4% | 15.6% |
| Standard Deviation (Population) | 6.4% | 15.5% |
Similar Demographics by Male Poverty
Demographics Similar to Chinese by Male Poverty
In terms of male poverty, the demographic groups most similar to Chinese are Thai (8.7%, a difference of 0.080%), Immigrants from Taiwan (8.9%, a difference of 2.4%), Maltese (9.1%, a difference of 4.4%), Assyrian/Chaldean/Syriac (9.1%, a difference of 5.1%), and Immigrants from Ireland (9.1%, a difference of 5.2%).
| Demographics | Rating | Rank | Male Poverty |
| Immigrants | India | 100.0 /100 | #1 | Exceptional 8.2% |
| Chinese | 100.0 /100 | #2 | Exceptional 8.7% |
| Thais | 100.0 /100 | #3 | Exceptional 8.7% |
| Immigrants | Taiwan | 100.0 /100 | #4 | Exceptional 8.9% |
| Maltese | 100.0 /100 | #5 | Exceptional 9.1% |
| Assyrians/Chaldeans/Syriacs | 99.9 /100 | #6 | Exceptional 9.1% |
| Immigrants | Ireland | 99.9 /100 | #7 | Exceptional 9.1% |
| Filipinos | 99.9 /100 | #8 | Exceptional 9.2% |
| Immigrants | South Central Asia | 99.9 /100 | #9 | Exceptional 9.3% |
| Bulgarians | 99.9 /100 | #10 | Exceptional 9.3% |
| Bolivians | 99.9 /100 | #11 | Exceptional 9.4% |
| Immigrants | Bolivia | 99.9 /100 | #12 | Exceptional 9.4% |
| Immigrants | Lithuania | 99.9 /100 | #13 | Exceptional 9.4% |
| Immigrants | North Macedonia | 99.8 /100 | #14 | Exceptional 9.4% |
| Bhutanese | 99.8 /100 | #15 | Exceptional 9.5% |
Demographics Similar to Spanish Americans by Male Poverty
In terms of male poverty, the demographic groups most similar to Spanish Americans are Cree (13.3%, a difference of 0.030%), Guyanese (13.3%, a difference of 0.50%), Subsaharan African (13.3%, a difference of 0.72%), Immigrants from Jamaica (13.3%, a difference of 0.75%), and Immigrants from Bahamas (13.5%, a difference of 0.75%).
| Demographics | Rating | Rank | Male Poverty |
| Iroquois | 0.1 /100 | #264 | Tragic 13.2% |
| Jamaicans | 0.1 /100 | #265 | Tragic 13.2% |
| Immigrants | Guyana | 0.1 /100 | #266 | Tragic 13.2% |
| Immigrants | Jamaica | 0.1 /100 | #267 | Tragic 13.3% |
| Sub-Saharan Africans | 0.1 /100 | #268 | Tragic 13.3% |
| Guyanese | 0.0 /100 | #269 | Tragic 13.3% |
| Cree | 0.0 /100 | #270 | Tragic 13.3% |
| Spanish Americans | 0.0 /100 | #271 | Tragic 13.4% |
| Immigrants | Bahamas | 0.0 /100 | #272 | Tragic 13.5% |
| Chickasaw | 0.0 /100 | #273 | Tragic 13.5% |
| Immigrants | West Indies | 0.0 /100 | #274 | Tragic 13.5% |
| Barbadians | 0.0 /100 | #275 | Tragic 13.6% |
| Immigrants | Latin America | 0.0 /100 | #276 | Tragic 13.6% |
| Bangladeshis | 0.0 /100 | #277 | Tragic 13.6% |
| Belizeans | 0.0 /100 | #278 | Tragic 13.6% |