Immigrants from St. Vincent and the Grenadines vs Spanish American Male Poverty
COMPARE
Immigrants from St. Vincent and the Grenadines
Spanish American
Male Poverty
Male Poverty Comparison
Immigrants from St. Vincent and the Grenadines
Spanish Americans
13.8%
MALE POVERTY
0.0/ 100
METRIC RATING
288th/ 347
METRIC RANK
13.4%
MALE POVERTY
0.0/ 100
METRIC RATING
271st/ 347
METRIC RANK
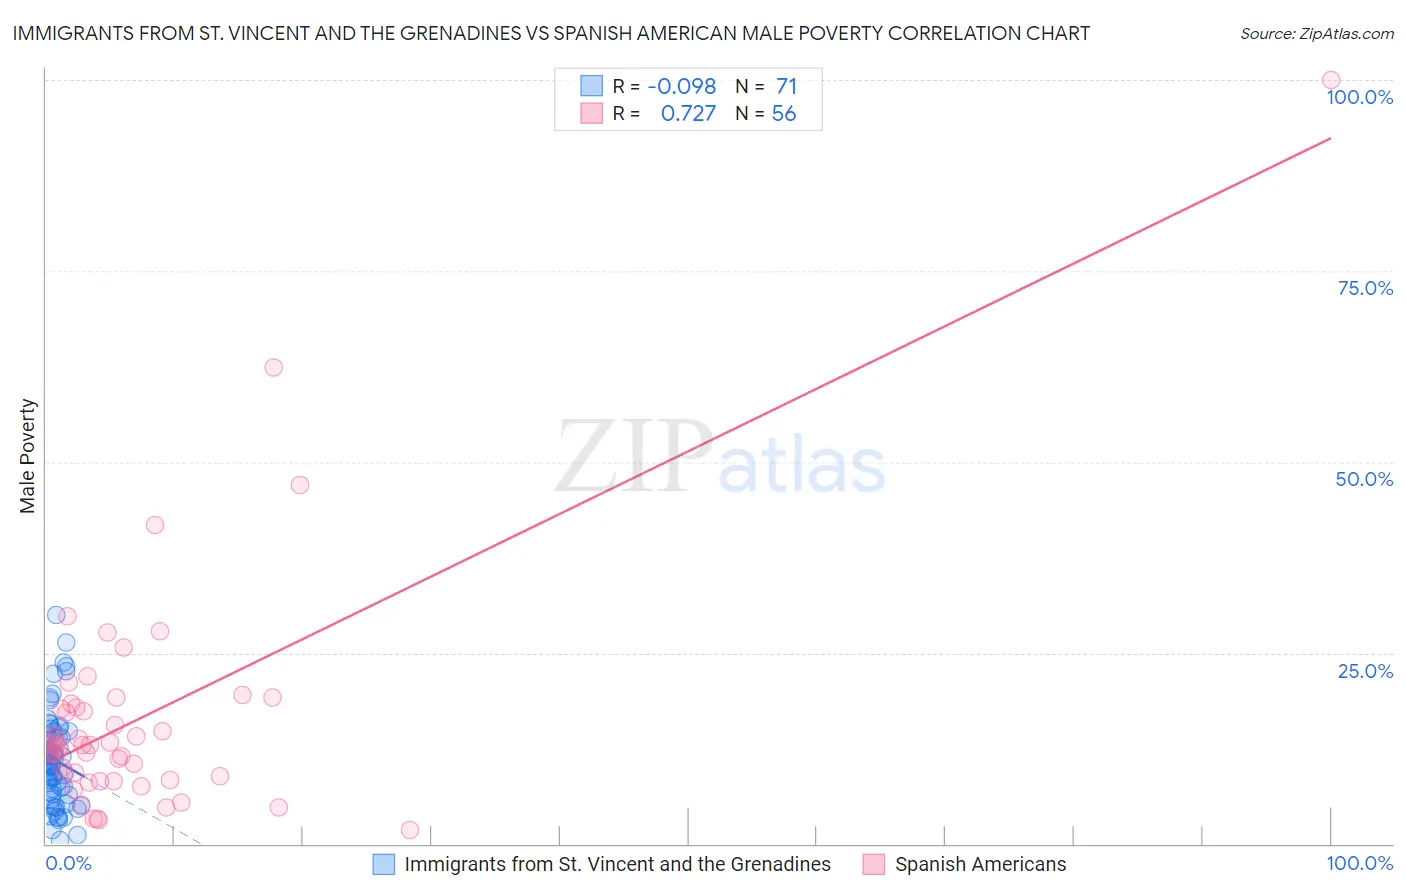
Immigrants from St. Vincent and the Grenadines vs Spanish American Male Poverty Correlation Chart
The statistical analysis conducted on geographies consisting of 56,096,349 people shows a slight negative correlation between the proportion of Immigrants from St. Vincent and the Grenadines and poverty level among males in the United States with a correlation coefficient (R) of -0.098 and weighted average of 13.8%. Similarly, the statistical analysis conducted on geographies consisting of 103,163,136 people shows a strong positive correlation between the proportion of Spanish Americans and poverty level among males in the United States with a correlation coefficient (R) of 0.727 and weighted average of 13.4%, a difference of 3.3%.
Male Poverty Correlation Summary
| Measurement | Immigrants from St. Vincent and the Grenadines | Spanish American |
| Minimum | 0.49% | 1.7% |
| Maximum | 29.9% | 100.0% |
| Range | 29.4% | 98.3% |
| Mean | 11.0% | 16.5% |
| Median | 10.4% | 13.0% |
| Interquartile 25% (IQ1) | 6.6% | 8.6% |
| Interquartile 75% (IQ3) | 14.2% | 18.0% |
| Interquartile Range (IQR) | 7.6% | 9.4% |
| Standard Deviation (Sample) | 6.1% | 15.6% |
| Standard Deviation (Population) | 6.0% | 15.5% |
Demographics Similar to Immigrants from St. Vincent and the Grenadines and Spanish Americans by Male Poverty
In terms of male poverty, the demographic groups most similar to Immigrants from St. Vincent and the Grenadines are Immigrants from Barbados (13.8%, a difference of 0.17%), Guatemalan (13.8%, a difference of 0.17%), Shoshone (13.8%, a difference of 0.18%), West Indian (13.8%, a difference of 0.22%), and Immigrants from Haiti (13.8%, a difference of 0.23%). Similarly, the demographic groups most similar to Spanish Americans are Cree (13.3%, a difference of 0.030%), Guyanese (13.3%, a difference of 0.50%), Immigrants from Bahamas (13.5%, a difference of 0.75%), Chickasaw (13.5%, a difference of 1.1%), and Immigrants from West Indies (13.5%, a difference of 1.1%).
| Demographics | Rating | Rank | Male Poverty |
| Guyanese | 0.0 /100 | #269 | Tragic 13.3% |
| Cree | 0.0 /100 | #270 | Tragic 13.3% |
| Spanish Americans | 0.0 /100 | #271 | Tragic 13.4% |
| Immigrants | Bahamas | 0.0 /100 | #272 | Tragic 13.5% |
| Chickasaw | 0.0 /100 | #273 | Tragic 13.5% |
| Immigrants | West Indies | 0.0 /100 | #274 | Tragic 13.5% |
| Barbadians | 0.0 /100 | #275 | Tragic 13.6% |
| Immigrants | Latin America | 0.0 /100 | #276 | Tragic 13.6% |
| Bangladeshis | 0.0 /100 | #277 | Tragic 13.6% |
| Belizeans | 0.0 /100 | #278 | Tragic 13.6% |
| Haitians | 0.0 /100 | #279 | Tragic 13.7% |
| Mexicans | 0.0 /100 | #280 | Tragic 13.7% |
| Yaqui | 0.0 /100 | #281 | Tragic 13.7% |
| Immigrants | Cabo Verde | 0.0 /100 | #282 | Tragic 13.7% |
| Comanche | 0.0 /100 | #283 | Tragic 13.8% |
| Immigrants | Haiti | 0.0 /100 | #284 | Tragic 13.8% |
| West Indians | 0.0 /100 | #285 | Tragic 13.8% |
| Shoshone | 0.0 /100 | #286 | Tragic 13.8% |
| Immigrants | Barbados | 0.0 /100 | #287 | Tragic 13.8% |
| Immigrants | St. Vincent and the Grenadines | 0.0 /100 | #288 | Tragic 13.8% |
| Guatemalans | 0.0 /100 | #289 | Tragic 13.8% |