Chinese vs Haitian Male Poverty
COMPARE
Chinese
Haitian
Male Poverty
Male Poverty Comparison
Chinese
Haitians
8.7%
MALE POVERTY
100.0/ 100
METRIC RATING
2nd/ 347
METRIC RANK
13.7%
MALE POVERTY
0.0/ 100
METRIC RATING
279th/ 347
METRIC RANK
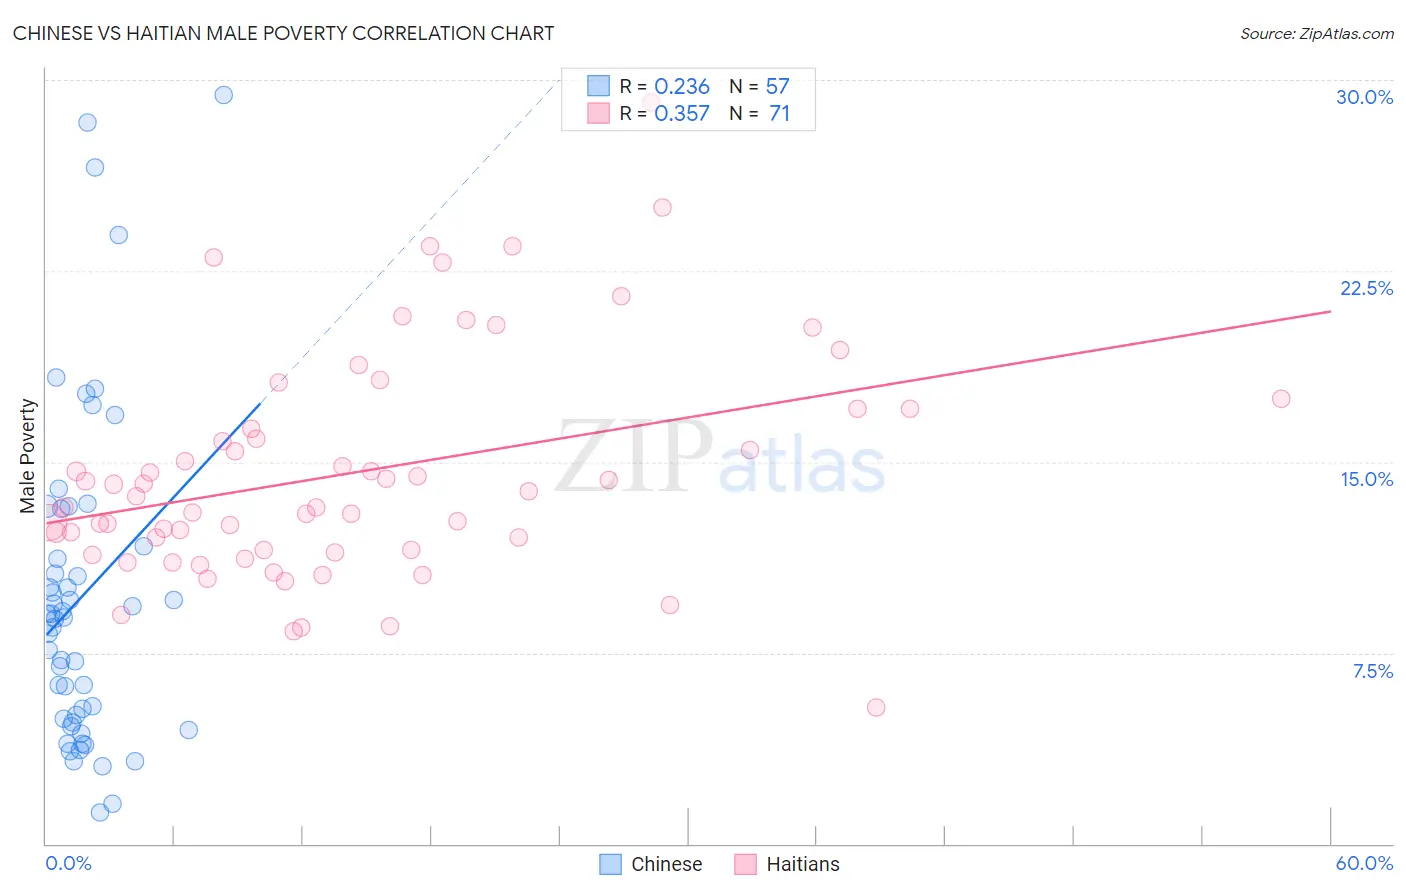
Chinese vs Haitian Male Poverty Correlation Chart
The statistical analysis conducted on geographies consisting of 64,801,112 people shows a weak positive correlation between the proportion of Chinese and poverty level among males in the United States with a correlation coefficient (R) of 0.236 and weighted average of 8.7%. Similarly, the statistical analysis conducted on geographies consisting of 287,676,273 people shows a mild positive correlation between the proportion of Haitians and poverty level among males in the United States with a correlation coefficient (R) of 0.357 and weighted average of 13.7%, a difference of 57.4%.
Male Poverty Correlation Summary
| Measurement | Chinese | Haitian |
| Minimum | 1.3% | 5.4% |
| Maximum | 29.4% | 29.1% |
| Range | 28.2% | 23.8% |
| Mean | 9.7% | 14.6% |
| Median | 8.9% | 13.7% |
| Interquartile 25% (IQ1) | 4.8% | 11.5% |
| Interquartile 75% (IQ3) | 12.4% | 17.1% |
| Interquartile Range (IQR) | 7.6% | 5.5% |
| Standard Deviation (Sample) | 6.4% | 4.5% |
| Standard Deviation (Population) | 6.4% | 4.4% |
Similar Demographics by Male Poverty
Demographics Similar to Chinese by Male Poverty
In terms of male poverty, the demographic groups most similar to Chinese are Thai (8.7%, a difference of 0.080%), Immigrants from Taiwan (8.9%, a difference of 2.4%), Maltese (9.1%, a difference of 4.4%), Assyrian/Chaldean/Syriac (9.1%, a difference of 5.1%), and Immigrants from Ireland (9.1%, a difference of 5.2%).
| Demographics | Rating | Rank | Male Poverty |
| Immigrants | India | 100.0 /100 | #1 | Exceptional 8.2% |
| Chinese | 100.0 /100 | #2 | Exceptional 8.7% |
| Thais | 100.0 /100 | #3 | Exceptional 8.7% |
| Immigrants | Taiwan | 100.0 /100 | #4 | Exceptional 8.9% |
| Maltese | 100.0 /100 | #5 | Exceptional 9.1% |
| Assyrians/Chaldeans/Syriacs | 99.9 /100 | #6 | Exceptional 9.1% |
| Immigrants | Ireland | 99.9 /100 | #7 | Exceptional 9.1% |
| Filipinos | 99.9 /100 | #8 | Exceptional 9.2% |
| Immigrants | South Central Asia | 99.9 /100 | #9 | Exceptional 9.3% |
| Bulgarians | 99.9 /100 | #10 | Exceptional 9.3% |
| Bolivians | 99.9 /100 | #11 | Exceptional 9.4% |
| Immigrants | Bolivia | 99.9 /100 | #12 | Exceptional 9.4% |
| Immigrants | Lithuania | 99.9 /100 | #13 | Exceptional 9.4% |
| Immigrants | North Macedonia | 99.8 /100 | #14 | Exceptional 9.4% |
| Bhutanese | 99.8 /100 | #15 | Exceptional 9.5% |
Demographics Similar to Haitians by Male Poverty
In terms of male poverty, the demographic groups most similar to Haitians are Mexican (13.7%, a difference of 0.090%), Yaqui (13.7%, a difference of 0.14%), Belizean (13.6%, a difference of 0.18%), Bangladeshi (13.6%, a difference of 0.27%), and Immigrants from Cabo Verde (13.7%, a difference of 0.41%).
| Demographics | Rating | Rank | Male Poverty |
| Immigrants | Bahamas | 0.0 /100 | #272 | Tragic 13.5% |
| Chickasaw | 0.0 /100 | #273 | Tragic 13.5% |
| Immigrants | West Indies | 0.0 /100 | #274 | Tragic 13.5% |
| Barbadians | 0.0 /100 | #275 | Tragic 13.6% |
| Immigrants | Latin America | 0.0 /100 | #276 | Tragic 13.6% |
| Bangladeshis | 0.0 /100 | #277 | Tragic 13.6% |
| Belizeans | 0.0 /100 | #278 | Tragic 13.6% |
| Haitians | 0.0 /100 | #279 | Tragic 13.7% |
| Mexicans | 0.0 /100 | #280 | Tragic 13.7% |
| Yaqui | 0.0 /100 | #281 | Tragic 13.7% |
| Immigrants | Cabo Verde | 0.0 /100 | #282 | Tragic 13.7% |
| Comanche | 0.0 /100 | #283 | Tragic 13.8% |
| Immigrants | Haiti | 0.0 /100 | #284 | Tragic 13.8% |
| West Indians | 0.0 /100 | #285 | Tragic 13.8% |
| Shoshone | 0.0 /100 | #286 | Tragic 13.8% |