Chilean vs Sierra Leonean Female Poverty Among 18-24 Year Olds
COMPARE
Chilean
Sierra Leonean
Female Poverty Among 18-24 Year Olds
Female Poverty Among 18-24 Year Olds Comparison
Chileans
Sierra Leoneans
19.1%
FEMALE POVERTY AMONG 18-24 YEAR OLDS
98.3/ 100
METRIC RATING
100th/ 347
METRIC RANK
19.0%
FEMALE POVERTY AMONG 18-24 YEAR OLDS
98.7/ 100
METRIC RATING
96th/ 347
METRIC RANK
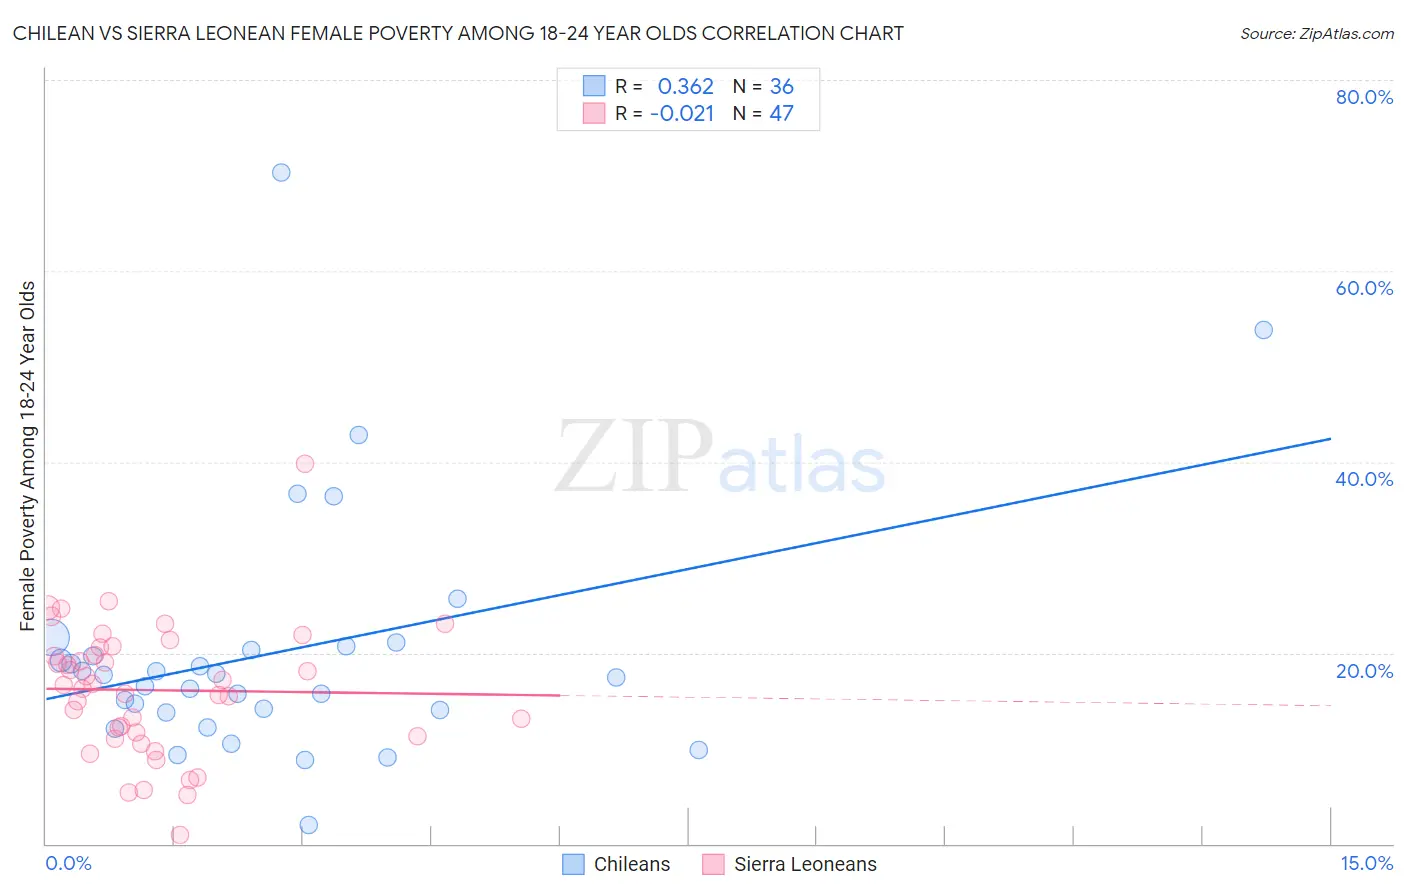
Chilean vs Sierra Leonean Female Poverty Among 18-24 Year Olds Correlation Chart
The statistical analysis conducted on geographies consisting of 253,129,963 people shows a mild positive correlation between the proportion of Chileans and poverty level among females between the ages 18 and 24 in the United States with a correlation coefficient (R) of 0.362 and weighted average of 19.1%. Similarly, the statistical analysis conducted on geographies consisting of 82,865,721 people shows no correlation between the proportion of Sierra Leoneans and poverty level among females between the ages 18 and 24 in the United States with a correlation coefficient (R) of -0.021 and weighted average of 19.0%, a difference of 0.36%.
Female Poverty Among 18-24 Year Olds Correlation Summary
| Measurement | Chilean | Sierra Leonean |
| Minimum | 2.0% | 0.87% |
| Maximum | 70.4% | 39.8% |
| Range | 68.4% | 38.9% |
| Mean | 20.1% | 16.1% |
| Median | 17.5% | 16.7% |
| Interquartile 25% (IQ1) | 13.9% | 11.3% |
| Interquartile 75% (IQ3) | 20.4% | 20.5% |
| Interquartile Range (IQR) | 6.6% | 9.2% |
| Standard Deviation (Sample) | 13.1% | 6.9% |
| Standard Deviation (Population) | 13.0% | 6.8% |
Demographics Similar to Chileans and Sierra Leoneans by Female Poverty Among 18-24 Year Olds
In terms of female poverty among 18-24 year olds, the demographic groups most similar to Chileans are Immigrants from Czechoslovakia (19.1%, a difference of 0.020%), Immigrants from Jordan (19.1%, a difference of 0.090%), Ecuadorian (19.1%, a difference of 0.090%), Salvadoran (19.1%, a difference of 0.10%), and Immigrants from Caribbean (19.1%, a difference of 0.11%). Similarly, the demographic groups most similar to Sierra Leoneans are Guamanian/Chamorro (19.0%, a difference of 0.10%), Ukrainian (19.0%, a difference of 0.17%), Haitian (19.0%, a difference of 0.23%), Filipino (19.0%, a difference of 0.26%), and Salvadoran (19.1%, a difference of 0.26%).
| Demographics | Rating | Rank | Female Poverty Among 18-24 Year Olds |
| Croatians | 99.1 /100 | #88 | Exceptional 19.0% |
| Immigrants | Cabo Verde | 99.0 /100 | #89 | Exceptional 19.0% |
| Afghans | 99.0 /100 | #90 | Exceptional 19.0% |
| Romanians | 98.9 /100 | #91 | Exceptional 19.0% |
| Filipinos | 98.9 /100 | #92 | Exceptional 19.0% |
| Haitians | 98.9 /100 | #93 | Exceptional 19.0% |
| Ukrainians | 98.8 /100 | #94 | Exceptional 19.0% |
| Guamanians/Chamorros | 98.8 /100 | #95 | Exceptional 19.0% |
| Sierra Leoneans | 98.7 /100 | #96 | Exceptional 19.0% |
| Salvadorans | 98.4 /100 | #97 | Exceptional 19.1% |
| Immigrants | Jordan | 98.4 /100 | #98 | Exceptional 19.1% |
| Immigrants | Czechoslovakia | 98.3 /100 | #99 | Exceptional 19.1% |
| Chileans | 98.3 /100 | #100 | Exceptional 19.1% |
| Ecuadorians | 98.1 /100 | #101 | Exceptional 19.1% |
| Immigrants | Caribbean | 98.1 /100 | #102 | Exceptional 19.1% |
| Serbians | 98.0 /100 | #103 | Exceptional 19.1% |
| Immigrants | Afghanistan | 98.0 /100 | #104 | Exceptional 19.1% |
| Immigrants | Ecuador | 97.8 /100 | #105 | Exceptional 19.2% |
| Immigrants | Sierra Leone | 97.8 /100 | #106 | Exceptional 19.2% |
| Immigrants | Sri Lanka | 97.5 /100 | #107 | Exceptional 19.2% |
| Immigrants | Uzbekistan | 97.3 /100 | #108 | Exceptional 19.2% |