Chilean vs Sierra Leonean 5th Grade
COMPARE
Chilean
Sierra Leonean
5th Grade
5th Grade Comparison
Chileans
Sierra Leoneans
97.3%
5TH GRADE
54.5/ 100
METRIC RATING
168th/ 347
METRIC RANK
97.1%
5TH GRADE
6.0/ 100
METRIC RATING
221st/ 347
METRIC RANK
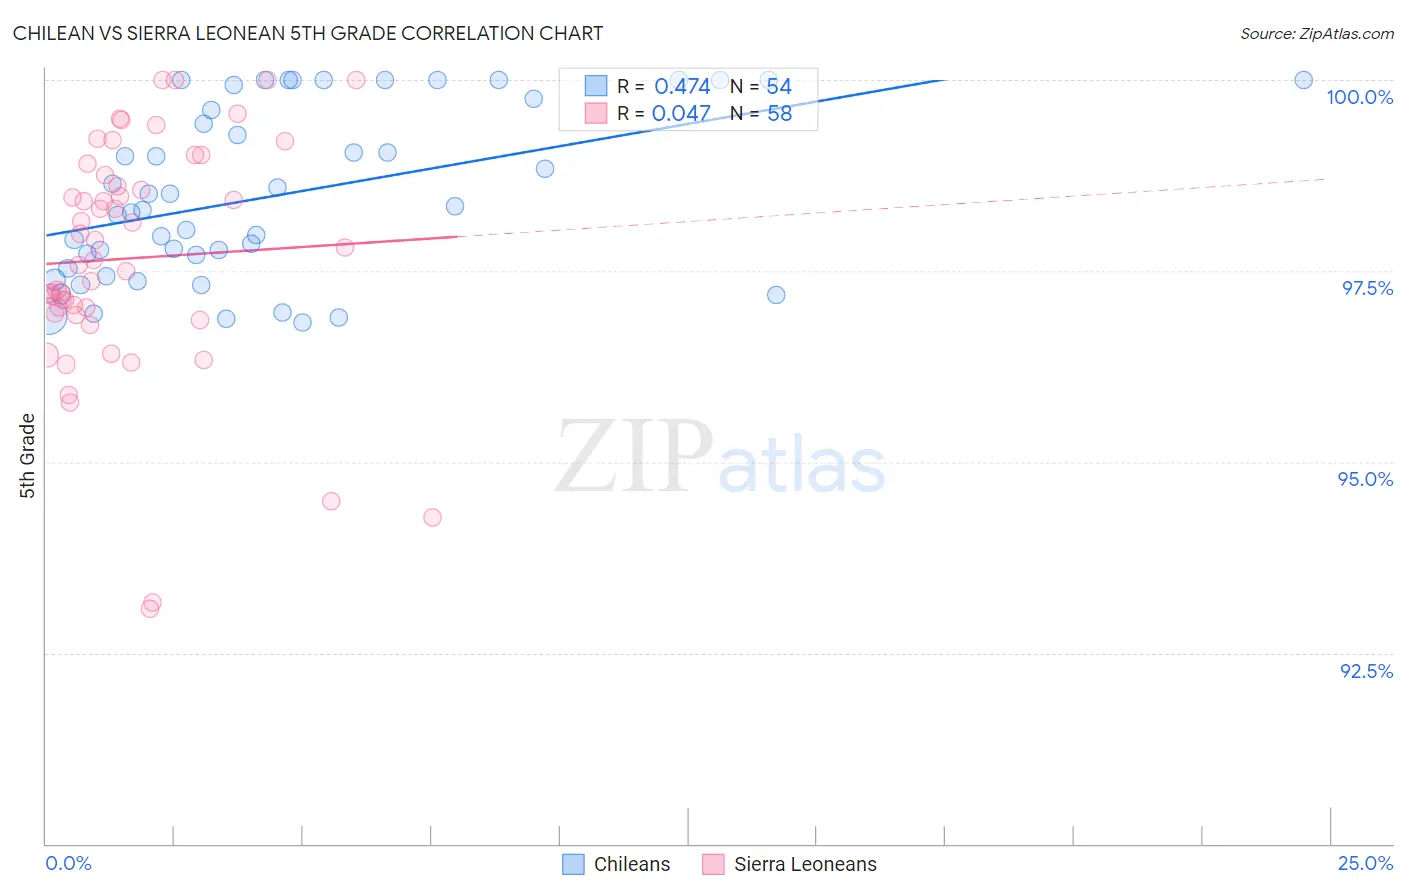
Chilean vs Sierra Leonean 5th Grade Correlation Chart
The statistical analysis conducted on geographies consisting of 256,683,580 people shows a moderate positive correlation between the proportion of Chileans and percentage of population with at least 5th grade education in the United States with a correlation coefficient (R) of 0.474 and weighted average of 97.3%. Similarly, the statistical analysis conducted on geographies consisting of 83,337,655 people shows no correlation between the proportion of Sierra Leoneans and percentage of population with at least 5th grade education in the United States with a correlation coefficient (R) of 0.047 and weighted average of 97.1%, a difference of 0.31%.
5th Grade Correlation Summary
| Measurement | Chilean | Sierra Leonean |
| Minimum | 96.8% | 93.1% |
| Maximum | 100.0% | 100.0% |
| Range | 3.2% | 6.9% |
| Mean | 98.5% | 97.7% |
| Median | 98.3% | 97.7% |
| Interquartile 25% (IQ1) | 97.5% | 96.9% |
| Interquartile 75% (IQ3) | 99.8% | 98.8% |
| Interquartile Range (IQR) | 2.2% | 1.8% |
| Standard Deviation (Sample) | 1.1% | 1.6% |
| Standard Deviation (Population) | 1.1% | 1.5% |
Similar Demographics by 5th Grade
Demographics Similar to Chileans by 5th Grade
In terms of 5th grade, the demographic groups most similar to Chileans are Immigrants from Belarus (97.3%, a difference of 0.0%), Immigrants from Korea (97.3%, a difference of 0.0%), Venezuelan (97.3%, a difference of 0.0%), Immigrants from Sri Lanka (97.3%, a difference of 0.0%), and Arab (97.3%, a difference of 0.0%).
| Demographics | Rating | Rank | 5th Grade |
| Kenyans | 59.7 /100 | #161 | Average 97.4% |
| Immigrants | Iran | 59.5 /100 | #162 | Average 97.4% |
| Ugandans | 58.9 /100 | #163 | Average 97.4% |
| Bermudans | 58.8 /100 | #164 | Average 97.4% |
| Immigrants | Poland | 57.9 /100 | #165 | Average 97.4% |
| Apache | 57.2 /100 | #166 | Average 97.4% |
| Immigrants | Belarus | 54.6 /100 | #167 | Average 97.3% |
| Chileans | 54.5 /100 | #168 | Average 97.3% |
| Immigrants | Korea | 54.1 /100 | #169 | Average 97.3% |
| Venezuelans | 54.0 /100 | #170 | Average 97.3% |
| Immigrants | Sri Lanka | 53.8 /100 | #171 | Average 97.3% |
| Arabs | 53.4 /100 | #172 | Average 97.3% |
| Egyptians | 52.4 /100 | #173 | Average 97.3% |
| Immigrants | Kazakhstan | 50.0 /100 | #174 | Average 97.3% |
| Immigrants | Micronesia | 48.8 /100 | #175 | Average 97.3% |
Demographics Similar to Sierra Leoneans by 5th Grade
In terms of 5th grade, the demographic groups most similar to Sierra Leoneans are Immigrants from Panama (97.0%, a difference of 0.0%), Immigrants from Lebanon (97.1%, a difference of 0.010%), Immigrants from Sudan (97.1%, a difference of 0.010%), Immigrants from Syria (97.1%, a difference of 0.010%), and Immigrants from Southern Europe (97.1%, a difference of 0.010%).
| Demographics | Rating | Rank | 5th Grade |
| Costa Ricans | 7.7 /100 | #214 | Tragic 97.1% |
| Immigrants | Morocco | 7.5 /100 | #215 | Tragic 97.1% |
| Sudanese | 7.0 /100 | #216 | Tragic 97.1% |
| Immigrants | Lebanon | 6.8 /100 | #217 | Tragic 97.1% |
| Immigrants | Sudan | 6.5 /100 | #218 | Tragic 97.1% |
| Immigrants | Syria | 6.4 /100 | #219 | Tragic 97.1% |
| Immigrants | Southern Europe | 6.3 /100 | #220 | Tragic 97.1% |
| Sierra Leoneans | 6.0 /100 | #221 | Tragic 97.1% |
| Immigrants | Panama | 5.7 /100 | #222 | Tragic 97.0% |
| Liberians | 5.7 /100 | #223 | Tragic 97.0% |
| South American Indians | 5.4 /100 | #224 | Tragic 97.0% |
| Bahamians | 5.3 /100 | #225 | Tragic 97.0% |
| Tongans | 5.3 /100 | #226 | Tragic 97.0% |
| Immigrants | Pakistan | 4.7 /100 | #227 | Tragic 97.0% |
| Assyrians/Chaldeans/Syriacs | 4.5 /100 | #228 | Tragic 97.0% |