Kiowa vs Sierra Leonean Female Poverty Among 18-24 Year Olds
COMPARE
Kiowa
Sierra Leonean
Female Poverty Among 18-24 Year Olds
Female Poverty Among 18-24 Year Olds Comparison
Kiowa
Sierra Leoneans
29.2%
FEMALE POVERTY AMONG 18-24 YEAR OLDS
0.0/ 100
METRIC RATING
342nd/ 347
METRIC RANK
19.0%
FEMALE POVERTY AMONG 18-24 YEAR OLDS
98.7/ 100
METRIC RATING
96th/ 347
METRIC RANK
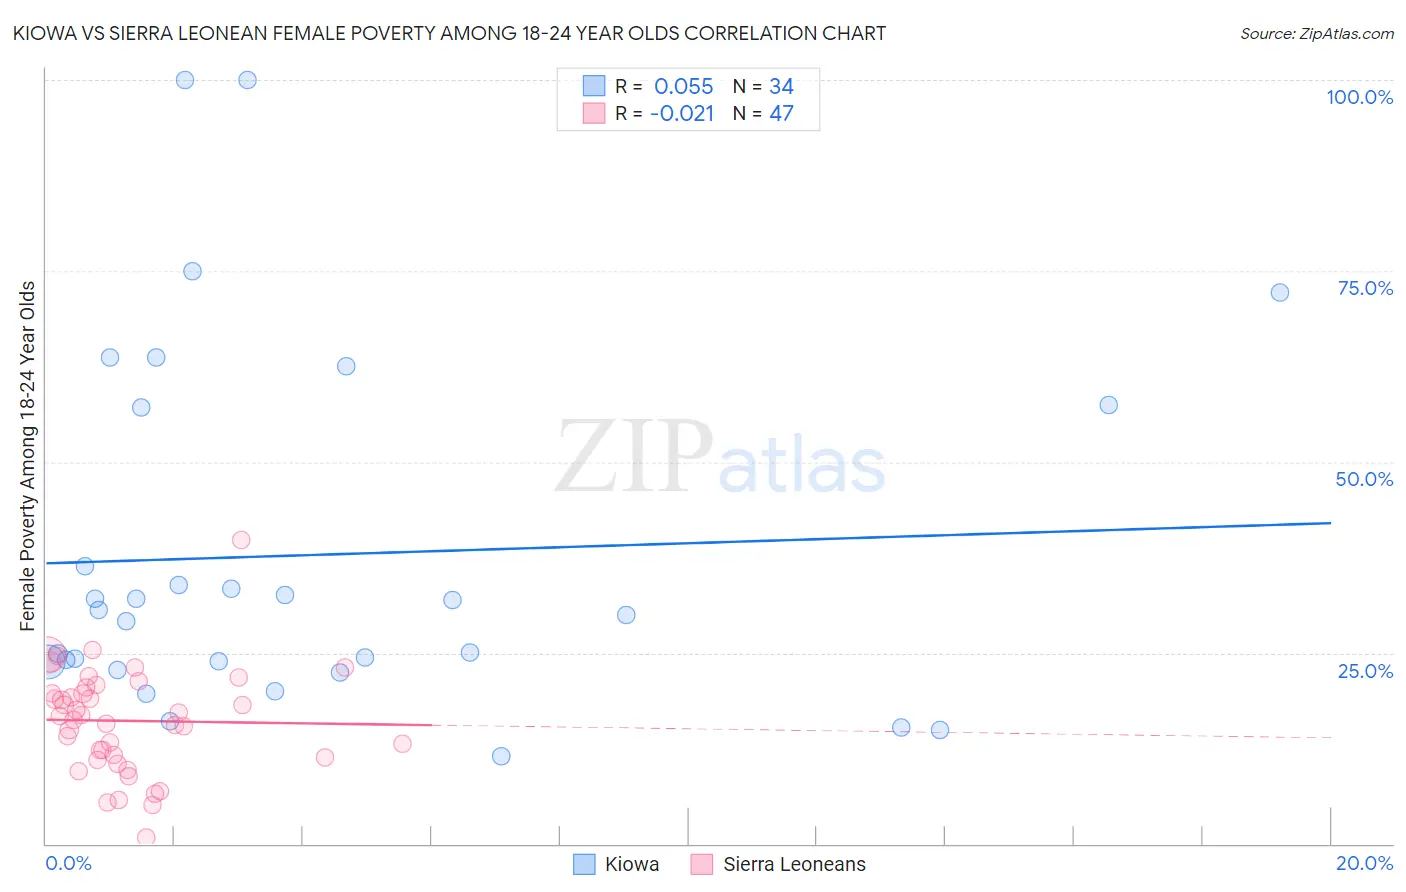
Kiowa vs Sierra Leonean Female Poverty Among 18-24 Year Olds Correlation Chart
The statistical analysis conducted on geographies consisting of 55,937,345 people shows a slight positive correlation between the proportion of Kiowa and poverty level among females between the ages 18 and 24 in the United States with a correlation coefficient (R) of 0.055 and weighted average of 29.2%. Similarly, the statistical analysis conducted on geographies consisting of 82,865,721 people shows no correlation between the proportion of Sierra Leoneans and poverty level among females between the ages 18 and 24 in the United States with a correlation coefficient (R) of -0.021 and weighted average of 19.0%, a difference of 53.5%.
Female Poverty Among 18-24 Year Olds Correlation Summary
| Measurement | Kiowa | Sierra Leonean |
| Minimum | 11.5% | 0.87% |
| Maximum | 100.0% | 39.8% |
| Range | 88.5% | 38.9% |
| Mean | 37.8% | 16.1% |
| Median | 30.3% | 16.7% |
| Interquartile 25% (IQ1) | 23.8% | 11.3% |
| Interquartile 75% (IQ3) | 57.1% | 20.5% |
| Interquartile Range (IQR) | 33.3% | 9.2% |
| Standard Deviation (Sample) | 23.3% | 6.9% |
| Standard Deviation (Population) | 23.0% | 6.8% |
Similar Demographics by Female Poverty Among 18-24 Year Olds
Demographics Similar to Kiowa by Female Poverty Among 18-24 Year Olds
In terms of female poverty among 18-24 year olds, the demographic groups most similar to Kiowa are Colville (29.0%, a difference of 0.74%), Puerto Rican (29.8%, a difference of 2.1%), Sioux (28.6%, a difference of 2.3%), Pima (28.4%, a difference of 2.9%), and Hopi (28.2%, a difference of 3.6%).
| Demographics | Rating | Rank | Female Poverty Among 18-24 Year Olds |
| Apache | 0.0 /100 | #333 | Tragic 26.3% |
| Pueblo | 0.0 /100 | #334 | Tragic 26.9% |
| Yup'ik | 0.0 /100 | #335 | Tragic 27.0% |
| Immigrants | Yemen | 0.0 /100 | #336 | Tragic 27.5% |
| Cheyenne | 0.0 /100 | #337 | Tragic 28.1% |
| Hopi | 0.0 /100 | #338 | Tragic 28.2% |
| Pima | 0.0 /100 | #339 | Tragic 28.4% |
| Sioux | 0.0 /100 | #340 | Tragic 28.6% |
| Colville | 0.0 /100 | #341 | Tragic 29.0% |
| Kiowa | 0.0 /100 | #342 | Tragic 29.2% |
| Puerto Ricans | 0.0 /100 | #343 | Tragic 29.8% |
| Navajo | 0.0 /100 | #344 | Tragic 30.3% |
| Tohono O'odham | 0.0 /100 | #345 | Tragic 31.0% |
| Lumbee | 0.0 /100 | #346 | Tragic 31.1% |
| Crow | 0.0 /100 | #347 | Tragic 33.2% |
Demographics Similar to Sierra Leoneans by Female Poverty Among 18-24 Year Olds
In terms of female poverty among 18-24 year olds, the demographic groups most similar to Sierra Leoneans are Guamanian/Chamorro (19.0%, a difference of 0.10%), Ukrainian (19.0%, a difference of 0.17%), Haitian (19.0%, a difference of 0.23%), Filipino (19.0%, a difference of 0.26%), and Salvadoran (19.1%, a difference of 0.26%).
| Demographics | Rating | Rank | Female Poverty Among 18-24 Year Olds |
| Immigrants | Cabo Verde | 99.0 /100 | #89 | Exceptional 19.0% |
| Afghans | 99.0 /100 | #90 | Exceptional 19.0% |
| Romanians | 98.9 /100 | #91 | Exceptional 19.0% |
| Filipinos | 98.9 /100 | #92 | Exceptional 19.0% |
| Haitians | 98.9 /100 | #93 | Exceptional 19.0% |
| Ukrainians | 98.8 /100 | #94 | Exceptional 19.0% |
| Guamanians/Chamorros | 98.8 /100 | #95 | Exceptional 19.0% |
| Sierra Leoneans | 98.7 /100 | #96 | Exceptional 19.0% |
| Salvadorans | 98.4 /100 | #97 | Exceptional 19.1% |
| Immigrants | Jordan | 98.4 /100 | #98 | Exceptional 19.1% |
| Immigrants | Czechoslovakia | 98.3 /100 | #99 | Exceptional 19.1% |
| Chileans | 98.3 /100 | #100 | Exceptional 19.1% |
| Ecuadorians | 98.1 /100 | #101 | Exceptional 19.1% |
| Immigrants | Caribbean | 98.1 /100 | #102 | Exceptional 19.1% |
| Serbians | 98.0 /100 | #103 | Exceptional 19.1% |