Chilean vs Sierra Leonean Householder Income Ages 45 - 64 years
COMPARE
Chilean
Sierra Leonean
Householder Income Ages 45 - 64 years
Householder Income Ages 45 - 64 years Comparison
Chileans
Sierra Leoneans
$106,611
HOUSEHOLDER INCOME AGES 45 - 64 YEARS
95.9/ 100
METRIC RATING
109th/ 347
METRIC RANK
$102,427
HOUSEHOLDER INCOME AGES 45 - 64 YEARS
74.2/ 100
METRIC RATING
159th/ 347
METRIC RANK
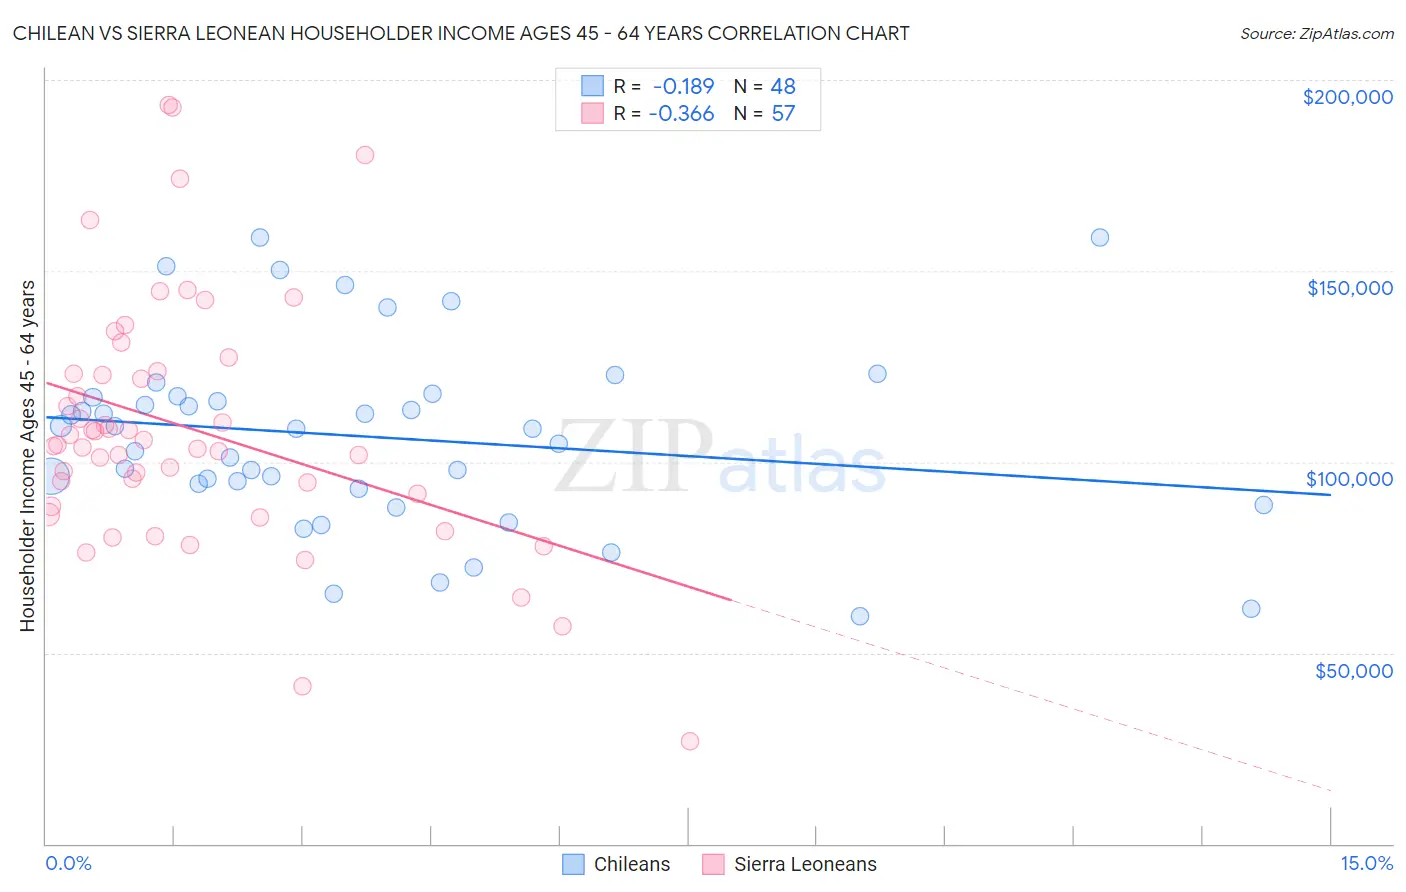
Chilean vs Sierra Leonean Householder Income Ages 45 - 64 years Correlation Chart
The statistical analysis conducted on geographies consisting of 256,404,590 people shows a poor negative correlation between the proportion of Chileans and household income with householder between the ages 45 and 64 in the United States with a correlation coefficient (R) of -0.189 and weighted average of $106,611. Similarly, the statistical analysis conducted on geographies consisting of 83,324,243 people shows a mild negative correlation between the proportion of Sierra Leoneans and household income with householder between the ages 45 and 64 in the United States with a correlation coefficient (R) of -0.366 and weighted average of $102,427, a difference of 4.1%.
Householder Income Ages 45 - 64 years Correlation Summary
| Measurement | Chilean | Sierra Leonean |
| Minimum | $59,712 | $26,764 |
| Maximum | $158,750 | $193,348 |
| Range | $99,038 | $166,584 |
| Mean | $106,575 | $108,787 |
| Median | $108,628 | $104,388 |
| Interquartile 25% (IQ1) | $93,623 | $89,997 |
| Interquartile 75% (IQ3) | $117,063 | $123,470 |
| Interquartile Range (IQR) | $23,441 | $33,473 |
| Standard Deviation (Sample) | $24,255 | $32,726 |
| Standard Deviation (Population) | $24,001 | $32,438 |
Similar Demographics by Householder Income Ages 45 - 64 years
Demographics Similar to Chileans by Householder Income Ages 45 - 64 years
In terms of householder income ages 45 - 64 years, the demographic groups most similar to Chileans are Immigrants from Brazil ($106,470, a difference of 0.13%), Immigrants from Vietnam ($106,417, a difference of 0.18%), Zimbabwean ($106,849, a difference of 0.22%), Swedish ($106,377, a difference of 0.22%), and European ($106,367, a difference of 0.23%).
| Demographics | Rating | Rank | Householder Income Ages 45 - 64 years |
| Immigrants | Moldova | 97.1 /100 | #102 | Exceptional $107,357 |
| Syrians | 96.9 /100 | #103 | Exceptional $107,207 |
| Immigrants | Ukraine | 96.7 /100 | #104 | Exceptional $107,079 |
| Macedonians | 96.7 /100 | #105 | Exceptional $107,074 |
| Armenians | 96.6 /100 | #106 | Exceptional $107,002 |
| Immigrants | Fiji | 96.5 /100 | #107 | Exceptional $106,952 |
| Zimbabweans | 96.3 /100 | #108 | Exceptional $106,849 |
| Chileans | 95.9 /100 | #109 | Exceptional $106,611 |
| Immigrants | Brazil | 95.6 /100 | #110 | Exceptional $106,470 |
| Immigrants | Vietnam | 95.5 /100 | #111 | Exceptional $106,417 |
| Swedes | 95.4 /100 | #112 | Exceptional $106,377 |
| Europeans | 95.4 /100 | #113 | Exceptional $106,367 |
| Immigrants | Poland | 95.3 /100 | #114 | Exceptional $106,319 |
| Immigrants | Kuwait | 95.2 /100 | #115 | Exceptional $106,285 |
| British | 95.2 /100 | #116 | Exceptional $106,264 |
Demographics Similar to Sierra Leoneans by Householder Income Ages 45 - 64 years
In terms of householder income ages 45 - 64 years, the demographic groups most similar to Sierra Leoneans are Icelander ($102,261, a difference of 0.16%), Slavic ($102,629, a difference of 0.20%), Immigrants from Nepal ($102,190, a difference of 0.23%), Scottish ($102,123, a difference of 0.30%), and Immigrants from Ethiopia ($102,763, a difference of 0.33%).
| Demographics | Rating | Rank | Householder Income Ages 45 - 64 years |
| Irish | 79.8 /100 | #152 | Good $103,067 |
| Scandinavians | 79.0 /100 | #153 | Good $102,969 |
| Slovenes | 78.3 /100 | #154 | Good $102,885 |
| Costa Ricans | 77.4 /100 | #155 | Good $102,779 |
| Carpatho Rusyns | 77.4 /100 | #156 | Good $102,777 |
| Immigrants | Ethiopia | 77.3 /100 | #157 | Good $102,763 |
| Slavs | 76.1 /100 | #158 | Good $102,629 |
| Sierra Leoneans | 74.2 /100 | #159 | Good $102,427 |
| Icelanders | 72.5 /100 | #160 | Good $102,261 |
| Immigrants | Nepal | 71.8 /100 | #161 | Good $102,190 |
| Scottish | 71.1 /100 | #162 | Good $102,123 |
| English | 70.1 /100 | #163 | Good $102,021 |
| Immigrants | Morocco | 70.0 /100 | #164 | Good $102,015 |
| Immigrants | Albania | 69.4 /100 | #165 | Good $101,957 |
| Samoans | 65.3 /100 | #166 | Good $101,580 |