Chilean vs Immigrants from Malaysia Child Poverty Under the Age of 16
COMPARE
Chilean
Immigrants from Malaysia
Child Poverty Under the Age of 16
Child Poverty Under the Age of 16 Comparison
Chileans
Immigrants from Malaysia
14.8%
CHILD POVERTY UNDER THE AGE OF 16
94.4/ 100
METRIC RATING
107th/ 347
METRIC RANK
15.0%
CHILD POVERTY UNDER THE AGE OF 16
92.6/ 100
METRIC RATING
118th/ 347
METRIC RANK
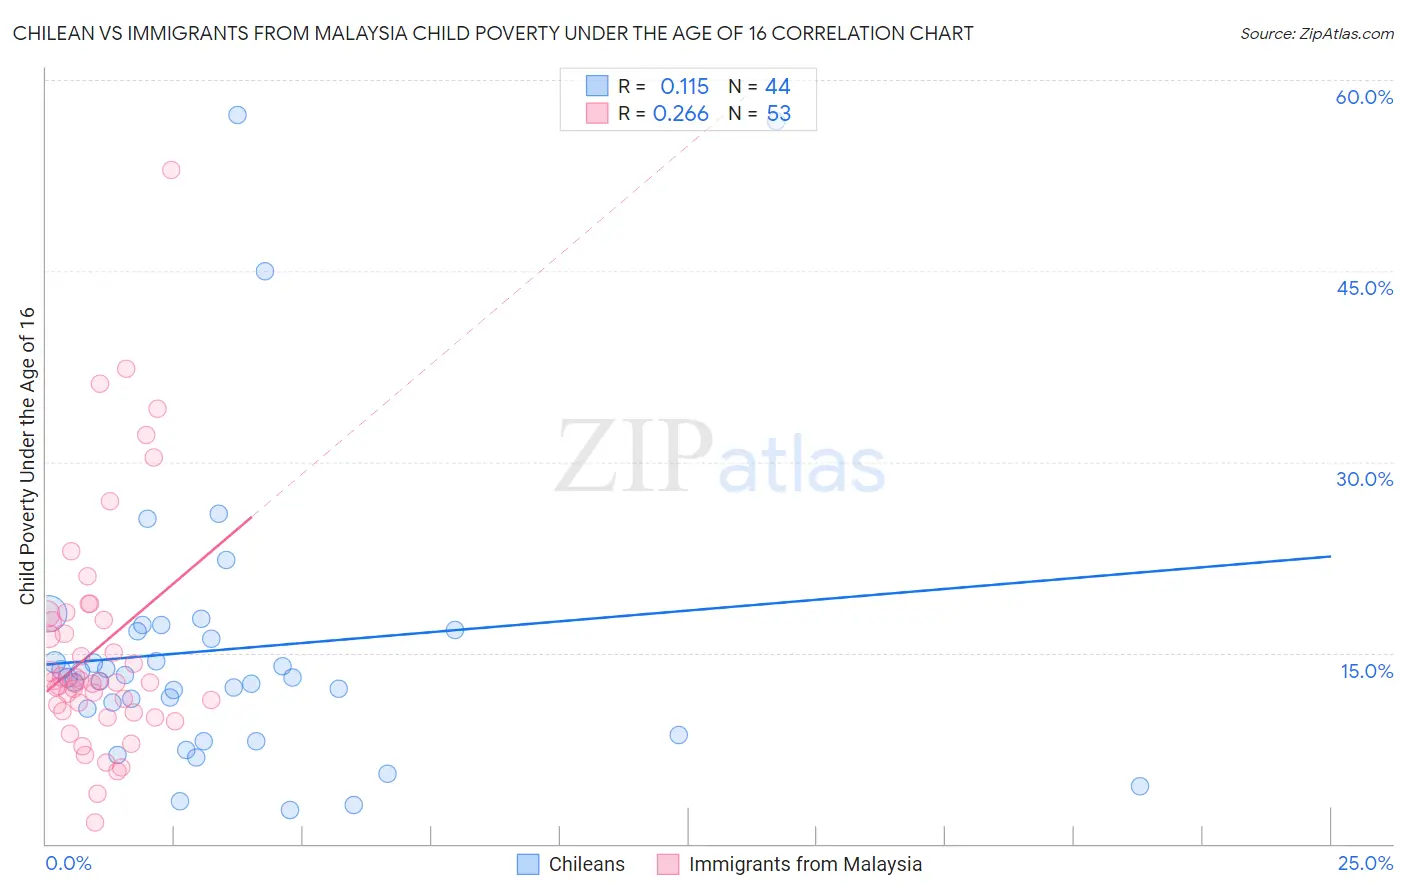
Chilean vs Immigrants from Malaysia Child Poverty Under the Age of 16 Correlation Chart
The statistical analysis conducted on geographies consisting of 255,499,348 people shows a poor positive correlation between the proportion of Chileans and poverty level among children under the age of 16 in the United States with a correlation coefficient (R) of 0.115 and weighted average of 14.8%. Similarly, the statistical analysis conducted on geographies consisting of 197,193,744 people shows a weak positive correlation between the proportion of Immigrants from Malaysia and poverty level among children under the age of 16 in the United States with a correlation coefficient (R) of 0.266 and weighted average of 15.0%, a difference of 0.93%.
Child Poverty Under the Age of 16 Correlation Summary
| Measurement | Chilean | Immigrants from Malaysia |
| Minimum | 2.6% | 1.7% |
| Maximum | 57.2% | 53.0% |
| Range | 54.6% | 51.3% |
| Mean | 15.3% | 15.4% |
| Median | 13.1% | 12.7% |
| Interquartile 25% (IQ1) | 9.6% | 10.4% |
| Interquartile 75% (IQ3) | 16.8% | 17.9% |
| Interquartile Range (IQR) | 7.2% | 7.5% |
| Standard Deviation (Sample) | 11.6% | 9.4% |
| Standard Deviation (Population) | 11.5% | 9.3% |
Demographics Similar to Chileans and Immigrants from Malaysia by Child Poverty Under the Age of 16
In terms of child poverty under the age of 16, the demographic groups most similar to Chileans are Serbian (14.8%, a difference of 0.060%), Jordanian (14.8%, a difference of 0.090%), Tlingit-Haida (14.9%, a difference of 0.16%), Basque (14.8%, a difference of 0.19%), and Immigrants from England (14.8%, a difference of 0.30%). Similarly, the demographic groups most similar to Immigrants from Malaysia are Immigrants from Norway (15.0%, a difference of 0.060%), Scottish (15.0%, a difference of 0.15%), Carpatho Rusyn (14.9%, a difference of 0.20%), Immigrants from Ukraine (14.9%, a difference of 0.23%), and South African (15.0%, a difference of 0.24%).
| Demographics | Rating | Rank | Child Poverty Under the Age of 16 |
| Romanians | 95.0 /100 | #102 | Exceptional 14.8% |
| Immigrants | Egypt | 94.9 /100 | #103 | Exceptional 14.8% |
| Immigrants | England | 94.8 /100 | #104 | Exceptional 14.8% |
| Basques | 94.7 /100 | #105 | Exceptional 14.8% |
| Serbians | 94.5 /100 | #106 | Exceptional 14.8% |
| Chileans | 94.4 /100 | #107 | Exceptional 14.8% |
| Jordanians | 94.2 /100 | #108 | Exceptional 14.8% |
| Tlingit-Haida | 94.1 /100 | #109 | Exceptional 14.9% |
| English | 93.5 /100 | #110 | Exceptional 14.9% |
| Immigrants | Denmark | 93.5 /100 | #111 | Exceptional 14.9% |
| Irish | 93.4 /100 | #112 | Exceptional 14.9% |
| Belgians | 93.3 /100 | #113 | Exceptional 14.9% |
| Sri Lankans | 93.2 /100 | #114 | Exceptional 14.9% |
| Immigrants | Ukraine | 93.1 /100 | #115 | Exceptional 14.9% |
| Carpatho Rusyns | 93.1 /100 | #116 | Exceptional 14.9% |
| Immigrants | Norway | 92.8 /100 | #117 | Exceptional 15.0% |
| Immigrants | Malaysia | 92.6 /100 | #118 | Exceptional 15.0% |
| Scottish | 92.3 /100 | #119 | Exceptional 15.0% |
| South Africans | 92.1 /100 | #120 | Exceptional 15.0% |
| Immigrants | Zimbabwe | 92.1 /100 | #121 | Exceptional 15.0% |
| Pakistanis | 91.7 /100 | #122 | Exceptional 15.0% |