Cheyenne vs Immigrants from Malaysia Child Poverty Under the Age of 16
COMPARE
Cheyenne
Immigrants from Malaysia
Child Poverty Under the Age of 16
Child Poverty Under the Age of 16 Comparison
Cheyenne
Immigrants from Malaysia
25.4%
CHILD POVERTY UNDER THE AGE OF 16
0.0/ 100
METRIC RATING
338th/ 347
METRIC RANK
15.0%
CHILD POVERTY UNDER THE AGE OF 16
92.6/ 100
METRIC RATING
118th/ 347
METRIC RANK
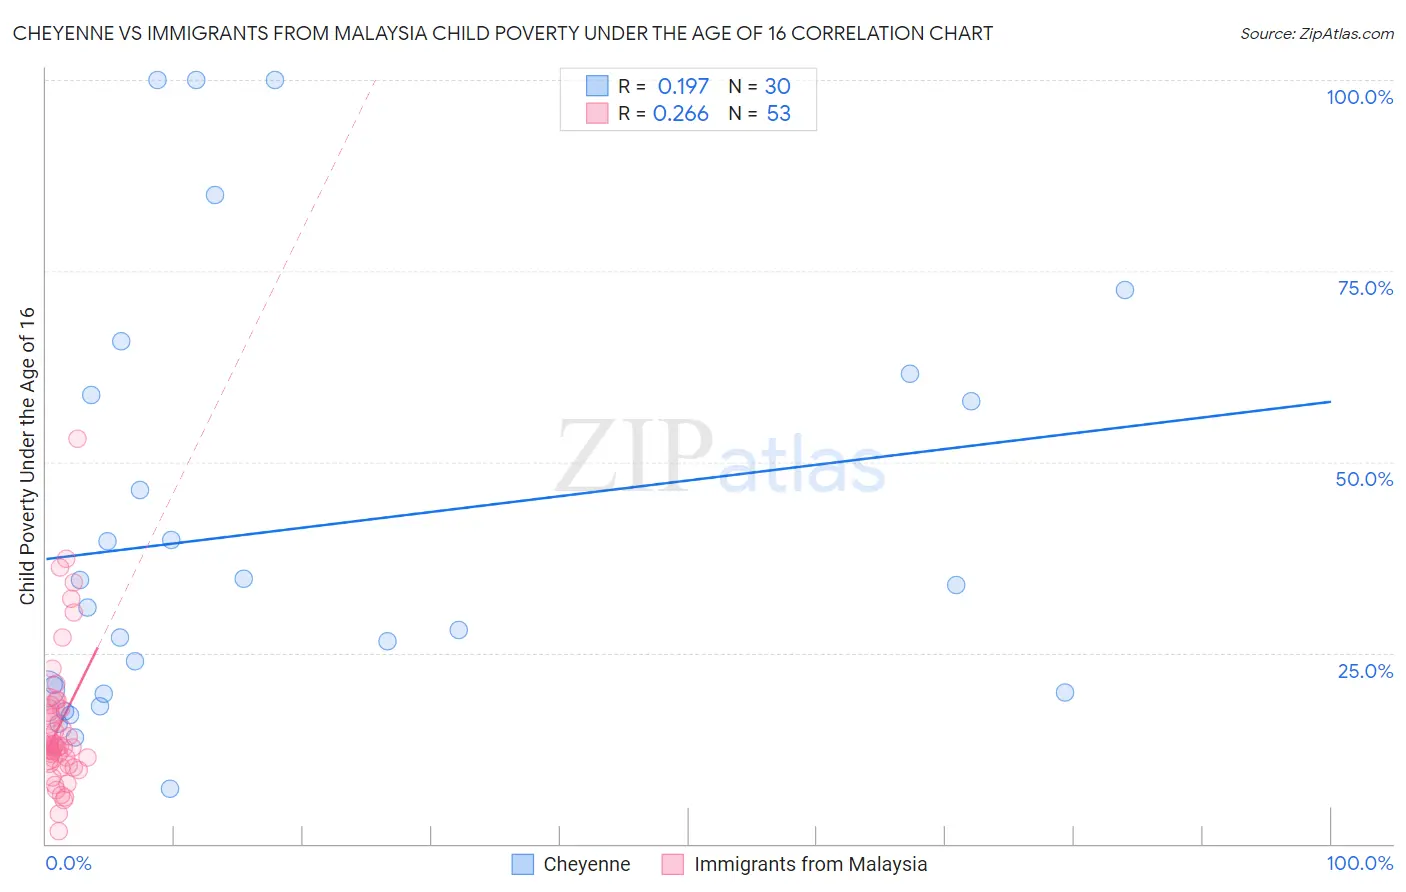
Cheyenne vs Immigrants from Malaysia Child Poverty Under the Age of 16 Correlation Chart
The statistical analysis conducted on geographies consisting of 80,519,978 people shows a poor positive correlation between the proportion of Cheyenne and poverty level among children under the age of 16 in the United States with a correlation coefficient (R) of 0.197 and weighted average of 25.4%. Similarly, the statistical analysis conducted on geographies consisting of 197,193,744 people shows a weak positive correlation between the proportion of Immigrants from Malaysia and poverty level among children under the age of 16 in the United States with a correlation coefficient (R) of 0.266 and weighted average of 15.0%, a difference of 69.5%.
Child Poverty Under the Age of 16 Correlation Summary
| Measurement | Cheyenne | Immigrants from Malaysia |
| Minimum | 7.1% | 1.7% |
| Maximum | 100.0% | 53.0% |
| Range | 92.9% | 51.3% |
| Mean | 41.2% | 15.4% |
| Median | 32.4% | 12.7% |
| Interquartile 25% (IQ1) | 19.9% | 10.4% |
| Interquartile 75% (IQ3) | 58.8% | 17.9% |
| Interquartile Range (IQR) | 38.9% | 7.5% |
| Standard Deviation (Sample) | 27.6% | 9.4% |
| Standard Deviation (Population) | 27.1% | 9.3% |
Similar Demographics by Child Poverty Under the Age of 16
Demographics Similar to Cheyenne by Child Poverty Under the Age of 16
In terms of child poverty under the age of 16, the demographic groups most similar to Cheyenne are Sioux (25.2%, a difference of 0.63%), Yup'ik (25.1%, a difference of 1.0%), Houma (24.9%, a difference of 2.1%), Crow (26.0%, a difference of 2.3%), and Black/African American (24.4%, a difference of 3.8%).
| Demographics | Rating | Rank | Child Poverty Under the Age of 16 |
| Apache | 0.0 /100 | #331 | Tragic 23.8% |
| Pueblo | 0.0 /100 | #332 | Tragic 23.9% |
| Immigrants | Dominican Republic | 0.0 /100 | #333 | Tragic 24.0% |
| Blacks/African Americans | 0.0 /100 | #334 | Tragic 24.4% |
| Houma | 0.0 /100 | #335 | Tragic 24.9% |
| Yup'ik | 0.0 /100 | #336 | Tragic 25.1% |
| Sioux | 0.0 /100 | #337 | Tragic 25.2% |
| Cheyenne | 0.0 /100 | #338 | Tragic 25.4% |
| Crow | 0.0 /100 | #339 | Tragic 26.0% |
| Hopi | 0.0 /100 | #340 | Tragic 27.1% |
| Yuman | 0.0 /100 | #341 | Tragic 28.9% |
| Pima | 0.0 /100 | #342 | Tragic 29.0% |
| Immigrants | Yemen | 0.0 /100 | #343 | Tragic 29.1% |
| Navajo | 0.0 /100 | #344 | Tragic 30.2% |
| Lumbee | 0.0 /100 | #345 | Tragic 31.0% |
Demographics Similar to Immigrants from Malaysia by Child Poverty Under the Age of 16
In terms of child poverty under the age of 16, the demographic groups most similar to Immigrants from Malaysia are Immigrants from Norway (15.0%, a difference of 0.060%), Scottish (15.0%, a difference of 0.15%), Carpatho Rusyn (14.9%, a difference of 0.20%), Immigrants from Ukraine (14.9%, a difference of 0.23%), and South African (15.0%, a difference of 0.24%).
| Demographics | Rating | Rank | Child Poverty Under the Age of 16 |
| Immigrants | Denmark | 93.5 /100 | #111 | Exceptional 14.9% |
| Irish | 93.4 /100 | #112 | Exceptional 14.9% |
| Belgians | 93.3 /100 | #113 | Exceptional 14.9% |
| Sri Lankans | 93.2 /100 | #114 | Exceptional 14.9% |
| Immigrants | Ukraine | 93.1 /100 | #115 | Exceptional 14.9% |
| Carpatho Rusyns | 93.1 /100 | #116 | Exceptional 14.9% |
| Immigrants | Norway | 92.8 /100 | #117 | Exceptional 15.0% |
| Immigrants | Malaysia | 92.6 /100 | #118 | Exceptional 15.0% |
| Scottish | 92.3 /100 | #119 | Exceptional 15.0% |
| South Africans | 92.1 /100 | #120 | Exceptional 15.0% |
| Immigrants | Zimbabwe | 92.1 /100 | #121 | Exceptional 15.0% |
| Pakistanis | 91.7 /100 | #122 | Exceptional 15.0% |
| Immigrants | Brazil | 91.1 /100 | #123 | Exceptional 15.1% |
| Czechoslovakians | 91.0 /100 | #124 | Exceptional 15.1% |
| Palestinians | 90.9 /100 | #125 | Exceptional 15.1% |