Immigrants from Caribbean vs Immigrants from Malaysia Child Poverty Under the Age of 16
COMPARE
Immigrants from Caribbean
Immigrants from Malaysia
Child Poverty Under the Age of 16
Child Poverty Under the Age of 16 Comparison
Immigrants from Caribbean
Immigrants from Malaysia
20.8%
CHILD POVERTY UNDER THE AGE OF 16
0.0/ 100
METRIC RATING
296th/ 347
METRIC RANK
15.0%
CHILD POVERTY UNDER THE AGE OF 16
92.6/ 100
METRIC RATING
118th/ 347
METRIC RANK
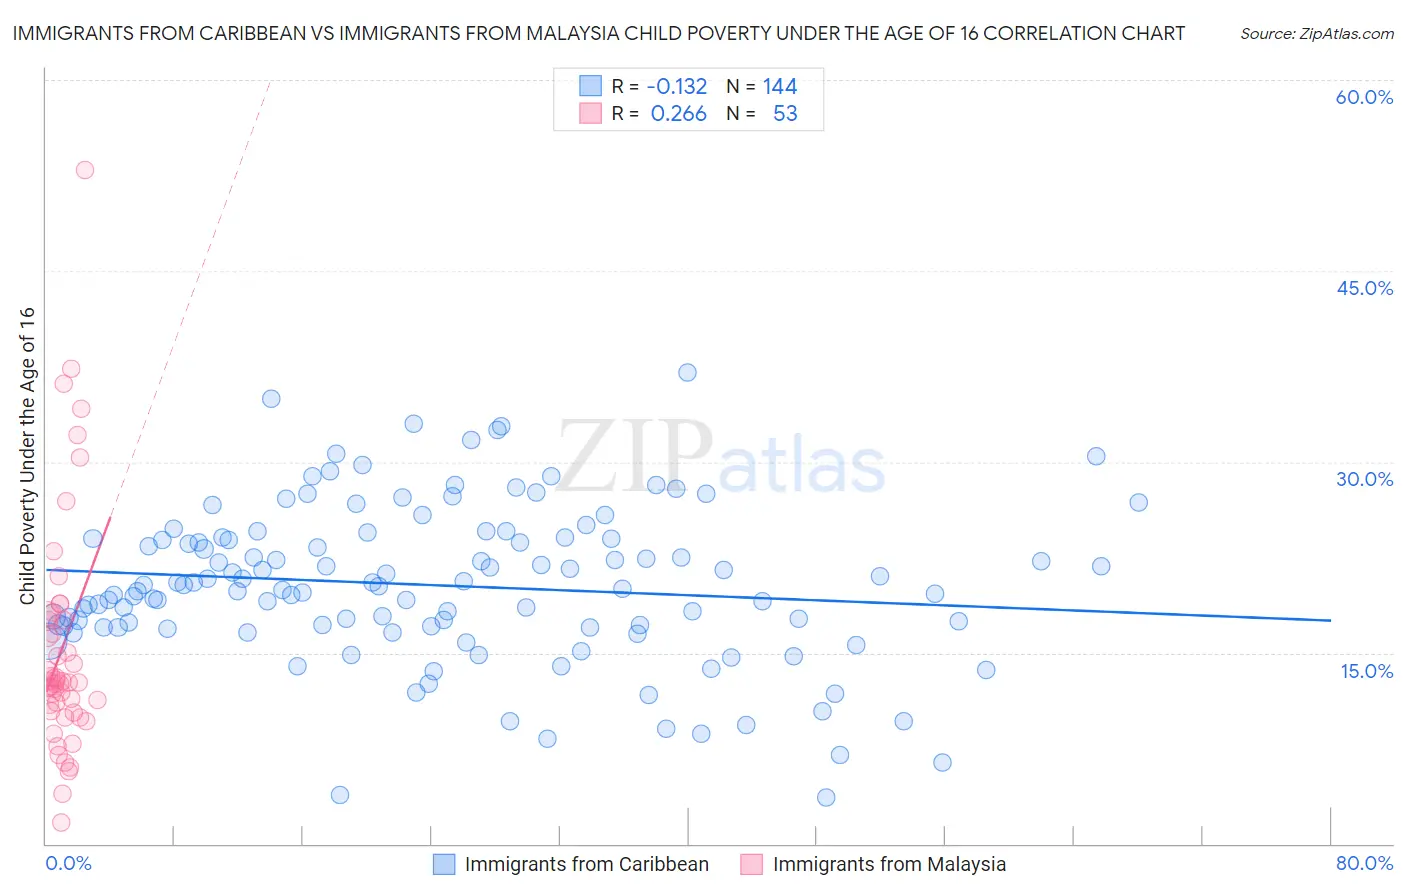
Immigrants from Caribbean vs Immigrants from Malaysia Child Poverty Under the Age of 16 Correlation Chart
The statistical analysis conducted on geographies consisting of 444,986,606 people shows a poor negative correlation between the proportion of Immigrants from Caribbean and poverty level among children under the age of 16 in the United States with a correlation coefficient (R) of -0.132 and weighted average of 20.8%. Similarly, the statistical analysis conducted on geographies consisting of 197,193,744 people shows a weak positive correlation between the proportion of Immigrants from Malaysia and poverty level among children under the age of 16 in the United States with a correlation coefficient (R) of 0.266 and weighted average of 15.0%, a difference of 38.7%.
Child Poverty Under the Age of 16 Correlation Summary
| Measurement | Immigrants from Caribbean | Immigrants from Malaysia |
| Minimum | 3.6% | 1.7% |
| Maximum | 37.0% | 53.0% |
| Range | 33.4% | 51.3% |
| Mean | 20.3% | 15.4% |
| Median | 20.1% | 12.7% |
| Interquartile 25% (IQ1) | 17.0% | 10.4% |
| Interquartile 75% (IQ3) | 24.0% | 17.9% |
| Interquartile Range (IQR) | 6.9% | 7.5% |
| Standard Deviation (Sample) | 6.1% | 9.4% |
| Standard Deviation (Population) | 6.1% | 9.3% |
Similar Demographics by Child Poverty Under the Age of 16
Demographics Similar to Immigrants from Caribbean by Child Poverty Under the Age of 16
In terms of child poverty under the age of 16, the demographic groups most similar to Immigrants from Caribbean are Hispanic or Latino (20.8%, a difference of 0.13%), Arapaho (20.8%, a difference of 0.13%), Mexican (20.7%, a difference of 0.38%), Immigrants from Haiti (20.9%, a difference of 0.43%), and Haitian (20.7%, a difference of 0.52%).
| Demographics | Rating | Rank | Child Poverty Under the Age of 16 |
| Senegalese | 0.0 /100 | #289 | Tragic 20.4% |
| Yaqui | 0.0 /100 | #290 | Tragic 20.4% |
| Chippewa | 0.0 /100 | #291 | Tragic 20.5% |
| Immigrants | Latin America | 0.0 /100 | #292 | Tragic 20.5% |
| Immigrants | Senegal | 0.0 /100 | #293 | Tragic 20.6% |
| Haitians | 0.0 /100 | #294 | Tragic 20.7% |
| Mexicans | 0.0 /100 | #295 | Tragic 20.7% |
| Immigrants | Caribbean | 0.0 /100 | #296 | Tragic 20.8% |
| Hispanics or Latinos | 0.0 /100 | #297 | Tragic 20.8% |
| Arapaho | 0.0 /100 | #298 | Tragic 20.8% |
| Immigrants | Haiti | 0.0 /100 | #299 | Tragic 20.9% |
| Indonesians | 0.0 /100 | #300 | Tragic 21.0% |
| Immigrants | Grenada | 0.0 /100 | #301 | Tragic 21.0% |
| Immigrants | Bahamas | 0.0 /100 | #302 | Tragic 21.0% |
| Choctaw | 0.0 /100 | #303 | Tragic 21.0% |
Demographics Similar to Immigrants from Malaysia by Child Poverty Under the Age of 16
In terms of child poverty under the age of 16, the demographic groups most similar to Immigrants from Malaysia are Immigrants from Norway (15.0%, a difference of 0.060%), Scottish (15.0%, a difference of 0.15%), Carpatho Rusyn (14.9%, a difference of 0.20%), Immigrants from Ukraine (14.9%, a difference of 0.23%), and South African (15.0%, a difference of 0.24%).
| Demographics | Rating | Rank | Child Poverty Under the Age of 16 |
| Immigrants | Denmark | 93.5 /100 | #111 | Exceptional 14.9% |
| Irish | 93.4 /100 | #112 | Exceptional 14.9% |
| Belgians | 93.3 /100 | #113 | Exceptional 14.9% |
| Sri Lankans | 93.2 /100 | #114 | Exceptional 14.9% |
| Immigrants | Ukraine | 93.1 /100 | #115 | Exceptional 14.9% |
| Carpatho Rusyns | 93.1 /100 | #116 | Exceptional 14.9% |
| Immigrants | Norway | 92.8 /100 | #117 | Exceptional 15.0% |
| Immigrants | Malaysia | 92.6 /100 | #118 | Exceptional 15.0% |
| Scottish | 92.3 /100 | #119 | Exceptional 15.0% |
| South Africans | 92.1 /100 | #120 | Exceptional 15.0% |
| Immigrants | Zimbabwe | 92.1 /100 | #121 | Exceptional 15.0% |
| Pakistanis | 91.7 /100 | #122 | Exceptional 15.0% |
| Immigrants | Brazil | 91.1 /100 | #123 | Exceptional 15.1% |
| Czechoslovakians | 91.0 /100 | #124 | Exceptional 15.1% |
| Palestinians | 90.9 /100 | #125 | Exceptional 15.1% |