Immigrants from Moldova vs Spanish Receiving Food Stamps
COMPARE
Immigrants from Moldova
Spanish
Receiving Food Stamps
Receiving Food Stamps Comparison
Immigrants from Moldova
Spanish
10.9%
RECEIVING FOOD STAMPS
88.5/ 100
METRIC RATING
138th/ 347
METRIC RANK
12.0%
RECEIVING FOOD STAMPS
36.9/ 100
METRIC RATING
186th/ 347
METRIC RANK
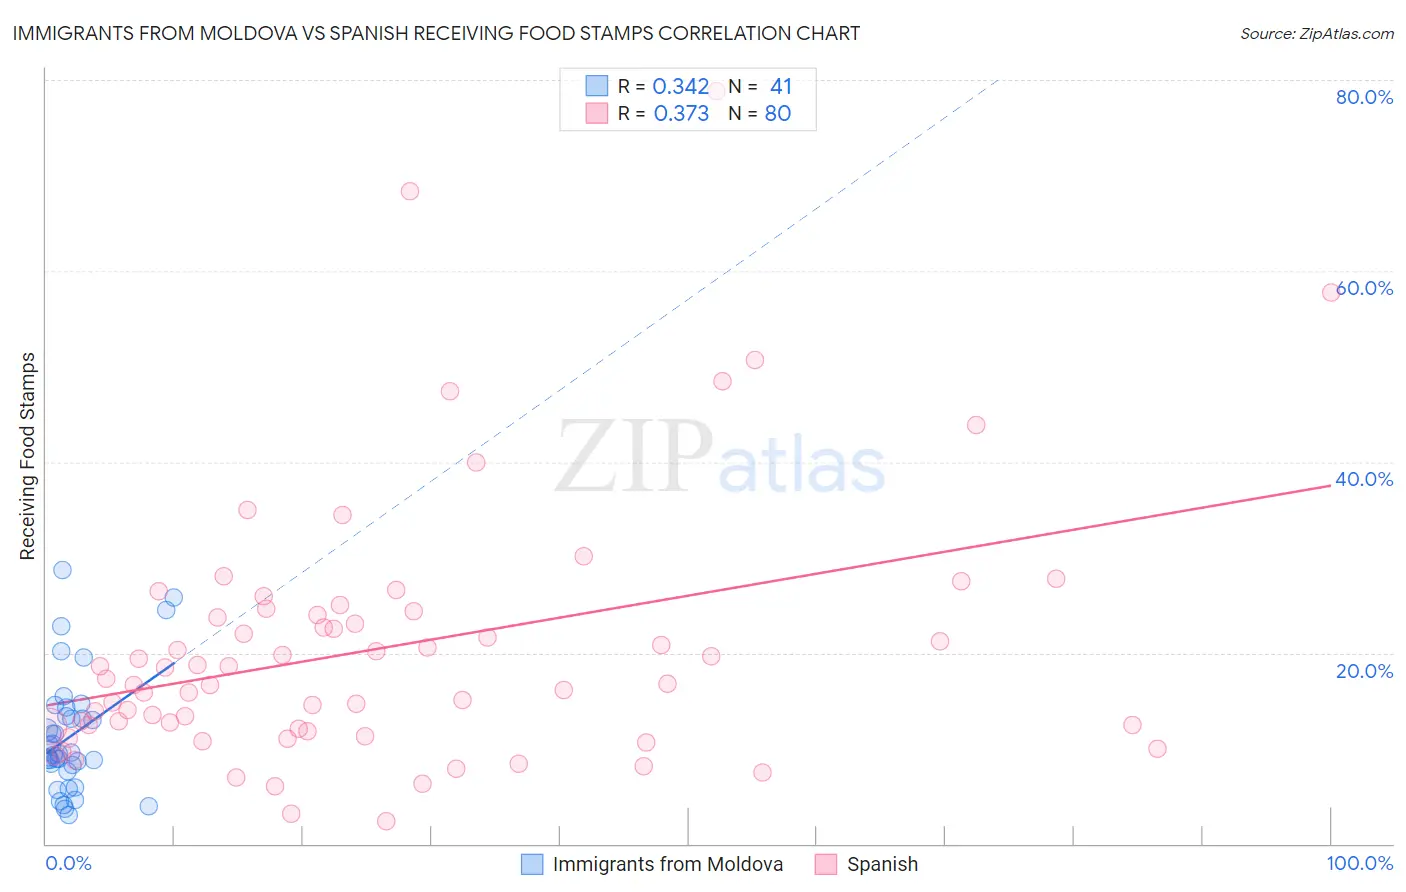
Immigrants from Moldova vs Spanish Receiving Food Stamps Correlation Chart
The statistical analysis conducted on geographies consisting of 124,289,346 people shows a mild positive correlation between the proportion of Immigrants from Moldova and percentage of population receiving government assistance and/or food stamps in the United States with a correlation coefficient (R) of 0.342 and weighted average of 10.9%. Similarly, the statistical analysis conducted on geographies consisting of 421,068,577 people shows a mild positive correlation between the proportion of Spanish and percentage of population receiving government assistance and/or food stamps in the United States with a correlation coefficient (R) of 0.373 and weighted average of 12.0%, a difference of 9.7%.
Receiving Food Stamps Correlation Summary
| Measurement | Immigrants from Moldova | Spanish |
| Minimum | 3.0% | 2.3% |
| Maximum | 28.7% | 78.8% |
| Range | 25.7% | 76.5% |
| Mean | 11.3% | 20.5% |
| Median | 9.4% | 17.0% |
| Interquartile 25% (IQ1) | 7.9% | 12.2% |
| Interquartile 75% (IQ3) | 13.8% | 24.1% |
| Interquartile Range (IQR) | 5.9% | 11.9% |
| Standard Deviation (Sample) | 6.2% | 13.8% |
| Standard Deviation (Population) | 6.1% | 13.7% |
Similar Demographics by Receiving Food Stamps
Demographics Similar to Immigrants from Moldova by Receiving Food Stamps
In terms of receiving food stamps, the demographic groups most similar to Immigrants from Moldova are Hmong (10.9%, a difference of 0.040%), Celtic (10.9%, a difference of 0.24%), Immigrants from Eastern Europe (10.8%, a difference of 0.51%), Slovak (10.8%, a difference of 0.53%), and Immigrants from Vietnam (11.0%, a difference of 0.61%).
| Demographics | Rating | Rank | Receiving Food Stamps |
| French | 92.3 /100 | #131 | Exceptional 10.7% |
| Immigrants | Germany | 92.0 /100 | #132 | Exceptional 10.7% |
| Immigrants | Russia | 90.9 /100 | #133 | Exceptional 10.8% |
| Immigrants | Brazil | 90.3 /100 | #134 | Exceptional 10.8% |
| Argentineans | 90.2 /100 | #135 | Exceptional 10.8% |
| Slovaks | 89.8 /100 | #136 | Excellent 10.8% |
| Immigrants | Eastern Europe | 89.8 /100 | #137 | Excellent 10.8% |
| Immigrants | Moldova | 88.5 /100 | #138 | Excellent 10.9% |
| Hmong | 88.4 /100 | #139 | Excellent 10.9% |
| Celtics | 87.8 /100 | #140 | Excellent 10.9% |
| Immigrants | Vietnam | 86.7 /100 | #141 | Excellent 11.0% |
| Chileans | 86.2 /100 | #142 | Excellent 11.0% |
| Immigrants | Northern Africa | 86.0 /100 | #143 | Excellent 11.0% |
| Syrians | 85.5 /100 | #144 | Excellent 11.0% |
| Hungarians | 85.1 /100 | #145 | Excellent 11.0% |
Demographics Similar to Spanish by Receiving Food Stamps
In terms of receiving food stamps, the demographic groups most similar to Spanish are Immigrants from Iraq (12.0%, a difference of 0.040%), Albanian (12.0%, a difference of 0.22%), Spaniard (11.9%, a difference of 0.42%), Immigrants from Uganda (11.9%, a difference of 0.50%), and Sudanese (12.0%, a difference of 0.52%).
| Demographics | Rating | Rank | Receiving Food Stamps |
| Immigrants | Kenya | 46.4 /100 | #179 | Average 11.8% |
| Uruguayans | 44.8 /100 | #180 | Average 11.8% |
| South American Indians | 41.7 /100 | #181 | Average 11.9% |
| Immigrants | Morocco | 40.7 /100 | #182 | Average 11.9% |
| Immigrants | Uganda | 40.3 /100 | #183 | Average 11.9% |
| Spaniards | 39.8 /100 | #184 | Fair 11.9% |
| Immigrants | Iraq | 37.1 /100 | #185 | Fair 12.0% |
| Spanish | 36.9 /100 | #186 | Fair 12.0% |
| Albanians | 35.4 /100 | #187 | Fair 12.0% |
| Sudanese | 33.4 /100 | #188 | Fair 12.0% |
| Immigrants | Cameroon | 32.5 /100 | #189 | Fair 12.0% |
| Immigrants | Peru | 32.2 /100 | #190 | Fair 12.0% |
| Venezuelans | 32.1 /100 | #191 | Fair 12.0% |
| Samoans | 31.0 /100 | #192 | Fair 12.1% |
| Immigrants | Fiji | 27.8 /100 | #193 | Fair 12.1% |