Immigrants from Ecuador vs Immigrants from Poland Female Poverty Among 25-34 Year Olds
COMPARE
Immigrants from Ecuador
Immigrants from Poland
Female Poverty Among 25-34 Year Olds
Female Poverty Among 25-34 Year Olds Comparison
Immigrants from Ecuador
Immigrants from Poland
14.6%
FEMALE POVERTY AMONG 25-34 YEAR OLDS
1.9/ 100
METRIC RATING
232nd/ 347
METRIC RANK
11.6%
FEMALE POVERTY AMONG 25-34 YEAR OLDS
99.9/ 100
METRIC RATING
33rd/ 347
METRIC RANK
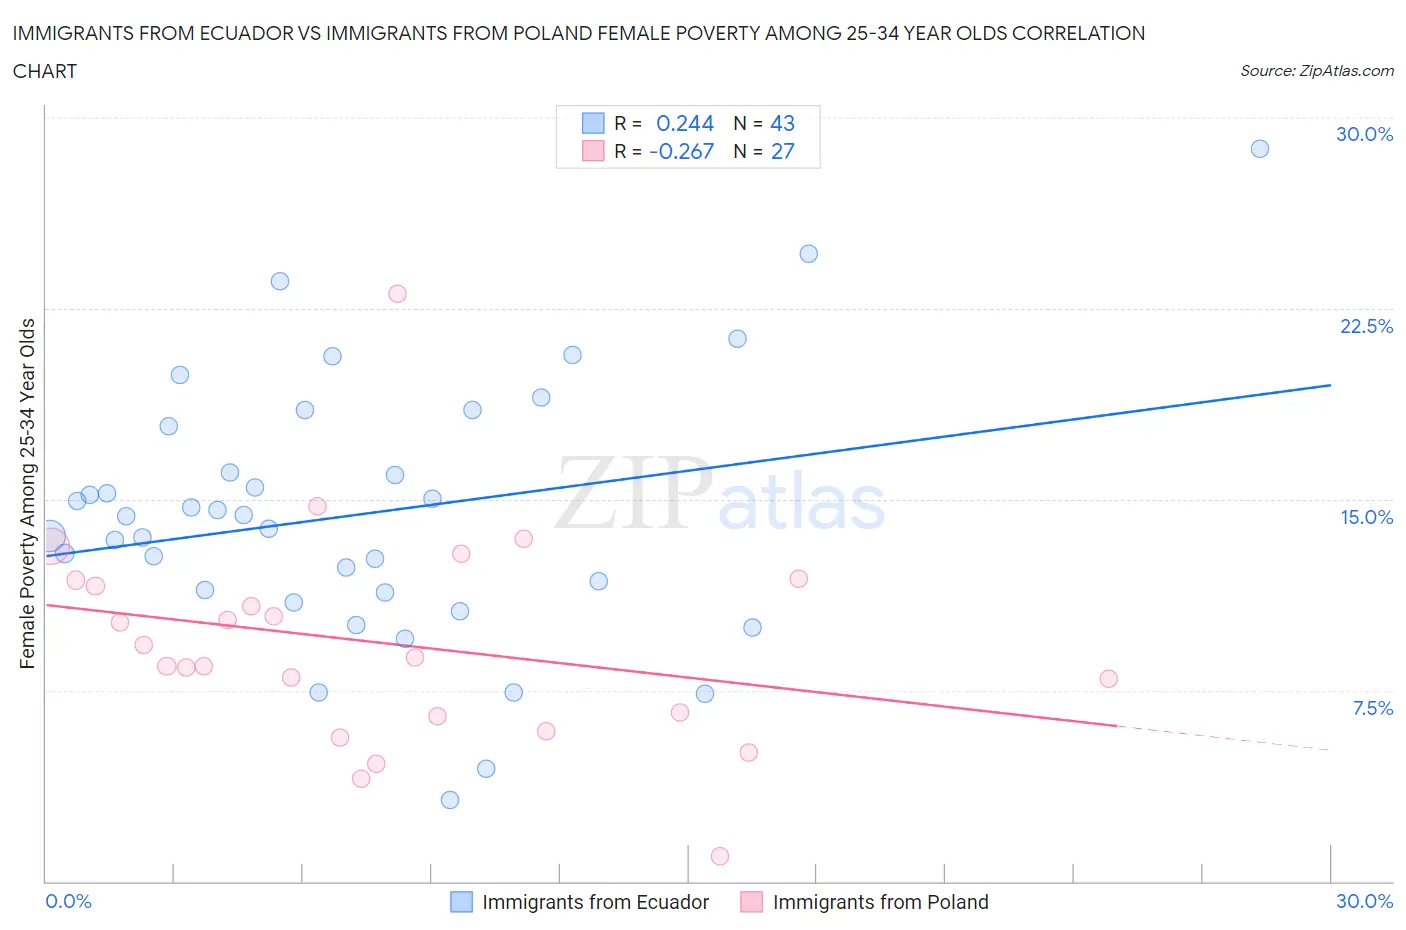
Immigrants from Ecuador vs Immigrants from Poland Female Poverty Among 25-34 Year Olds Correlation Chart
The statistical analysis conducted on geographies consisting of 268,011,049 people shows a weak positive correlation between the proportion of Immigrants from Ecuador and poverty level among females between the ages 25 and 34 in the United States with a correlation coefficient (R) of 0.244 and weighted average of 14.6%. Similarly, the statistical analysis conducted on geographies consisting of 299,264,805 people shows a weak negative correlation between the proportion of Immigrants from Poland and poverty level among females between the ages 25 and 34 in the United States with a correlation coefficient (R) of -0.267 and weighted average of 11.6%, a difference of 25.8%.
Female Poverty Among 25-34 Year Olds Correlation Summary
| Measurement | Immigrants from Ecuador | Immigrants from Poland |
| Minimum | 3.2% | 0.98% |
| Maximum | 28.8% | 23.1% |
| Range | 25.6% | 22.1% |
| Mean | 14.4% | 9.4% |
| Median | 14.3% | 8.8% |
| Interquartile 25% (IQ1) | 11.3% | 6.5% |
| Interquartile 75% (IQ3) | 17.9% | 11.8% |
| Interquartile Range (IQR) | 6.5% | 5.4% |
| Standard Deviation (Sample) | 5.2% | 4.3% |
| Standard Deviation (Population) | 5.1% | 4.2% |
Similar Demographics by Female Poverty Among 25-34 Year Olds
Demographics Similar to Immigrants from Ecuador by Female Poverty Among 25-34 Year Olds
In terms of female poverty among 25-34 year olds, the demographic groups most similar to Immigrants from Ecuador are White/Caucasian (14.7%, a difference of 0.18%), Delaware (14.6%, a difference of 0.31%), Spaniard (14.6%, a difference of 0.36%), Cuban (14.7%, a difference of 0.41%), and Spanish (14.6%, a difference of 0.49%).
| Demographics | Rating | Rank | Female Poverty Among 25-34 Year Olds |
| Immigrants | Barbados | 3.4 /100 | #225 | Tragic 14.5% |
| Nicaraguans | 3.3 /100 | #226 | Tragic 14.5% |
| Celtics | 2.8 /100 | #227 | Tragic 14.5% |
| Vietnamese | 2.6 /100 | #228 | Tragic 14.6% |
| Spanish | 2.5 /100 | #229 | Tragic 14.6% |
| Spaniards | 2.3 /100 | #230 | Tragic 14.6% |
| Delaware | 2.3 /100 | #231 | Tragic 14.6% |
| Immigrants | Ecuador | 1.9 /100 | #232 | Tragic 14.6% |
| Whites/Caucasians | 1.8 /100 | #233 | Tragic 14.7% |
| Cubans | 1.6 /100 | #234 | Tragic 14.7% |
| Immigrants | Jamaica | 1.4 /100 | #235 | Tragic 14.7% |
| Salvadorans | 1.4 /100 | #236 | Tragic 14.7% |
| Immigrants | Ghana | 1.4 /100 | #237 | Tragic 14.7% |
| Alsatians | 1.4 /100 | #238 | Tragic 14.7% |
| Malaysians | 1.4 /100 | #239 | Tragic 14.7% |
Demographics Similar to Immigrants from Poland by Female Poverty Among 25-34 Year Olds
In terms of female poverty among 25-34 year olds, the demographic groups most similar to Immigrants from Poland are Zimbabwean (11.7%, a difference of 0.22%), Immigrants from Asia (11.6%, a difference of 0.35%), Cambodian (11.7%, a difference of 0.49%), Immigrants from Japan (11.6%, a difference of 0.65%), and Cypriot (11.5%, a difference of 0.94%).
| Demographics | Rating | Rank | Female Poverty Among 25-34 Year Olds |
| Tongans | 99.9 /100 | #26 | Exceptional 11.5% |
| Immigrants | Greece | 99.9 /100 | #27 | Exceptional 11.5% |
| Immigrants | Pakistan | 99.9 /100 | #28 | Exceptional 11.5% |
| Bulgarians | 99.9 /100 | #29 | Exceptional 11.5% |
| Cypriots | 99.9 /100 | #30 | Exceptional 11.5% |
| Immigrants | Japan | 99.9 /100 | #31 | Exceptional 11.6% |
| Immigrants | Asia | 99.9 /100 | #32 | Exceptional 11.6% |
| Immigrants | Poland | 99.9 /100 | #33 | Exceptional 11.6% |
| Zimbabweans | 99.9 /100 | #34 | Exceptional 11.7% |
| Cambodians | 99.9 /100 | #35 | Exceptional 11.7% |
| Immigrants | Sri Lanka | 99.8 /100 | #36 | Exceptional 11.8% |
| Taiwanese | 99.8 /100 | #37 | Exceptional 11.8% |
| Immigrants | North Macedonia | 99.8 /100 | #38 | Exceptional 11.8% |
| Latvians | 99.8 /100 | #39 | Exceptional 11.8% |
| Immigrants | Bulgaria | 99.8 /100 | #40 | Exceptional 11.8% |