Immigrants from Taiwan vs Immigrants from Australia Receiving Food Stamps
COMPARE
Immigrants from Taiwan
Immigrants from Australia
Receiving Food Stamps
Receiving Food Stamps Comparison
Immigrants from Taiwan
Immigrants from Australia
7.3%
RECEIVING FOOD STAMPS
100.0/ 100
METRIC RATING
1st/ 347
METRIC RANK
9.2%
RECEIVING FOOD STAMPS
99.8/ 100
METRIC RATING
22nd/ 347
METRIC RANK
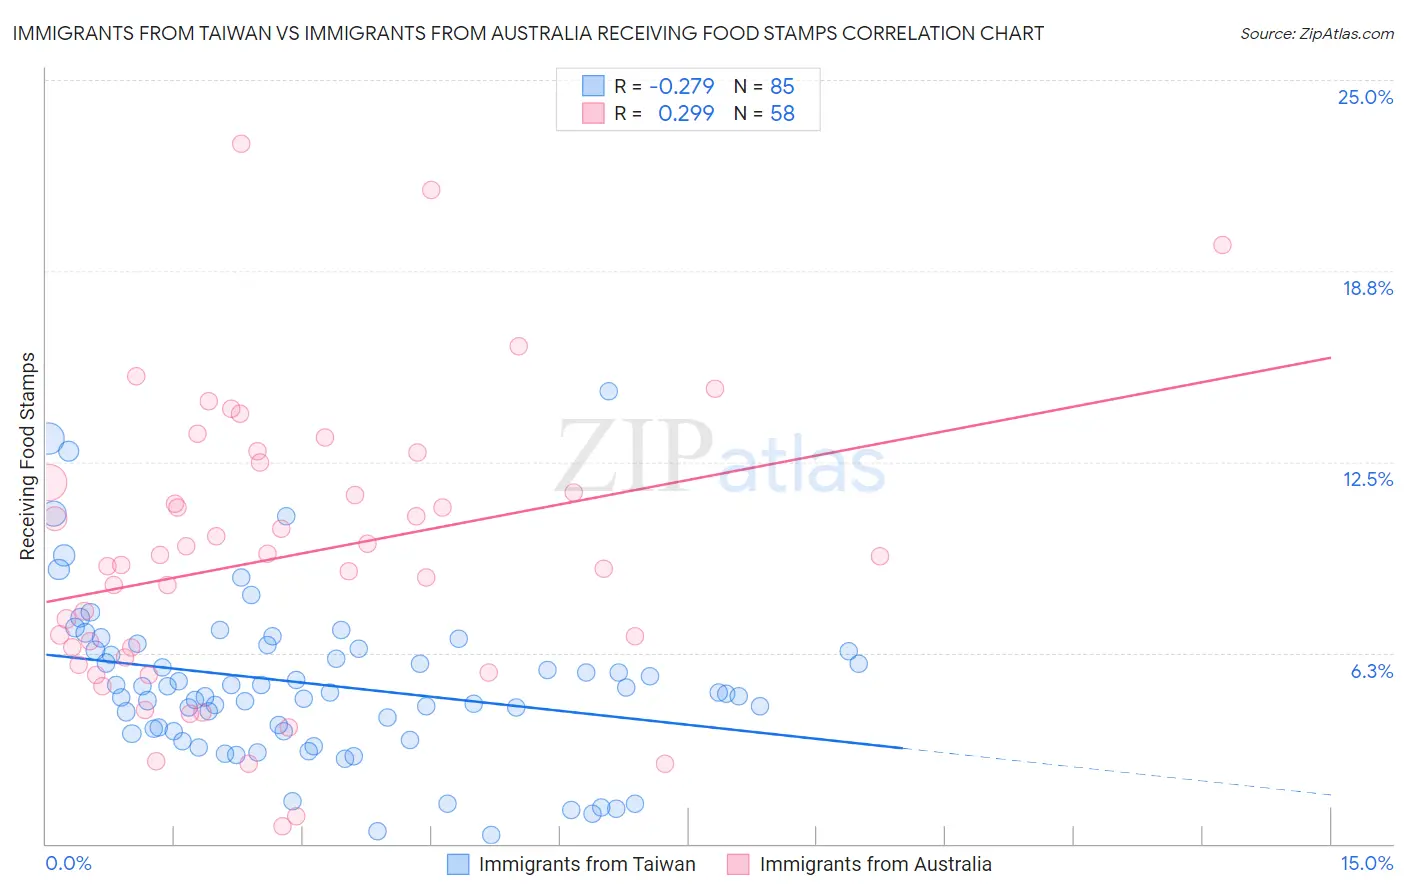
Immigrants from Taiwan vs Immigrants from Australia Receiving Food Stamps Correlation Chart
The statistical analysis conducted on geographies consisting of 297,390,748 people shows a weak negative correlation between the proportion of Immigrants from Taiwan and percentage of population receiving government assistance and/or food stamps in the United States with a correlation coefficient (R) of -0.279 and weighted average of 7.3%. Similarly, the statistical analysis conducted on geographies consisting of 226,603,605 people shows a weak positive correlation between the proportion of Immigrants from Australia and percentage of population receiving government assistance and/or food stamps in the United States with a correlation coefficient (R) of 0.299 and weighted average of 9.2%, a difference of 25.3%.
Receiving Food Stamps Correlation Summary
| Measurement | Immigrants from Taiwan | Immigrants from Australia |
| Minimum | 0.30% | 0.57% |
| Maximum | 14.8% | 22.9% |
| Range | 14.5% | 22.3% |
| Mean | 5.2% | 9.4% |
| Median | 4.9% | 9.3% |
| Interquartile 25% (IQ1) | 3.7% | 6.1% |
| Interquartile 75% (IQ3) | 6.4% | 11.8% |
| Interquartile Range (IQR) | 2.7% | 5.7% |
| Standard Deviation (Sample) | 2.7% | 4.7% |
| Standard Deviation (Population) | 2.7% | 4.6% |
Similar Demographics by Receiving Food Stamps
Demographics Similar to Immigrants from Taiwan by Receiving Food Stamps
In terms of receiving food stamps, the demographic groups most similar to Immigrants from Taiwan are Immigrants from India (7.4%, a difference of 0.87%), Filipino (7.4%, a difference of 1.1%), Iranian (7.9%, a difference of 8.5%), Thai (8.1%, a difference of 11.0%), and Immigrants from Singapore (8.3%, a difference of 13.6%).
| Demographics | Rating | Rank | Receiving Food Stamps |
| Immigrants | Taiwan | 100.0 /100 | #1 | Exceptional 7.3% |
| Immigrants | India | 100.0 /100 | #2 | Exceptional 7.4% |
| Filipinos | 100.0 /100 | #3 | Exceptional 7.4% |
| Iranians | 100.0 /100 | #4 | Exceptional 7.9% |
| Thais | 100.0 /100 | #5 | Exceptional 8.1% |
| Immigrants | Singapore | 100.0 /100 | #6 | Exceptional 8.3% |
| Immigrants | Iran | 100.0 /100 | #7 | Exceptional 8.3% |
| Burmese | 99.9 /100 | #8 | Exceptional 8.6% |
| Immigrants | Korea | 99.9 /100 | #9 | Exceptional 8.7% |
| Immigrants | South Central Asia | 99.9 /100 | #10 | Exceptional 8.8% |
| Okinawans | 99.9 /100 | #11 | Exceptional 8.9% |
| Cypriots | 99.9 /100 | #12 | Exceptional 8.9% |
| Bulgarians | 99.9 /100 | #13 | Exceptional 8.9% |
| Maltese | 99.9 /100 | #14 | Exceptional 8.9% |
| Norwegians | 99.9 /100 | #15 | Exceptional 9.0% |
Demographics Similar to Immigrants from Australia by Receiving Food Stamps
In terms of receiving food stamps, the demographic groups most similar to Immigrants from Australia are Eastern European (9.2%, a difference of 0.11%), Immigrants from Northern Europe (9.2%, a difference of 0.13%), Immigrants from Ireland (9.2%, a difference of 0.24%), Luxembourger (9.1%, a difference of 0.25%), and Latvian (9.1%, a difference of 0.40%).
| Demographics | Rating | Rank | Receiving Food Stamps |
| Norwegians | 99.9 /100 | #15 | Exceptional 9.0% |
| Immigrants | Japan | 99.9 /100 | #16 | Exceptional 9.0% |
| Immigrants | Scotland | 99.9 /100 | #17 | Exceptional 9.0% |
| Danes | 99.9 /100 | #18 | Exceptional 9.0% |
| Immigrants | Hong Kong | 99.8 /100 | #19 | Exceptional 9.1% |
| Latvians | 99.8 /100 | #20 | Exceptional 9.1% |
| Luxembourgers | 99.8 /100 | #21 | Exceptional 9.1% |
| Immigrants | Australia | 99.8 /100 | #22 | Exceptional 9.2% |
| Eastern Europeans | 99.8 /100 | #23 | Exceptional 9.2% |
| Immigrants | Northern Europe | 99.8 /100 | #24 | Exceptional 9.2% |
| Immigrants | Ireland | 99.8 /100 | #25 | Exceptional 9.2% |
| Swedes | 99.8 /100 | #26 | Exceptional 9.2% |
| Bhutanese | 99.8 /100 | #27 | Exceptional 9.2% |
| Czechs | 99.8 /100 | #28 | Exceptional 9.2% |
| Immigrants | Lithuania | 99.8 /100 | #29 | Exceptional 9.2% |