Central American vs Immigrants from Europe Male Poverty
COMPARE
Central American
Immigrants from Europe
Male Poverty
Male Poverty Comparison
Central Americans
Immigrants from Europe
13.2%
MALE POVERTY
0.1/ 100
METRIC RATING
263rd/ 347
METRIC RANK
10.1%
MALE POVERTY
97.9/ 100
METRIC RATING
59th/ 347
METRIC RANK
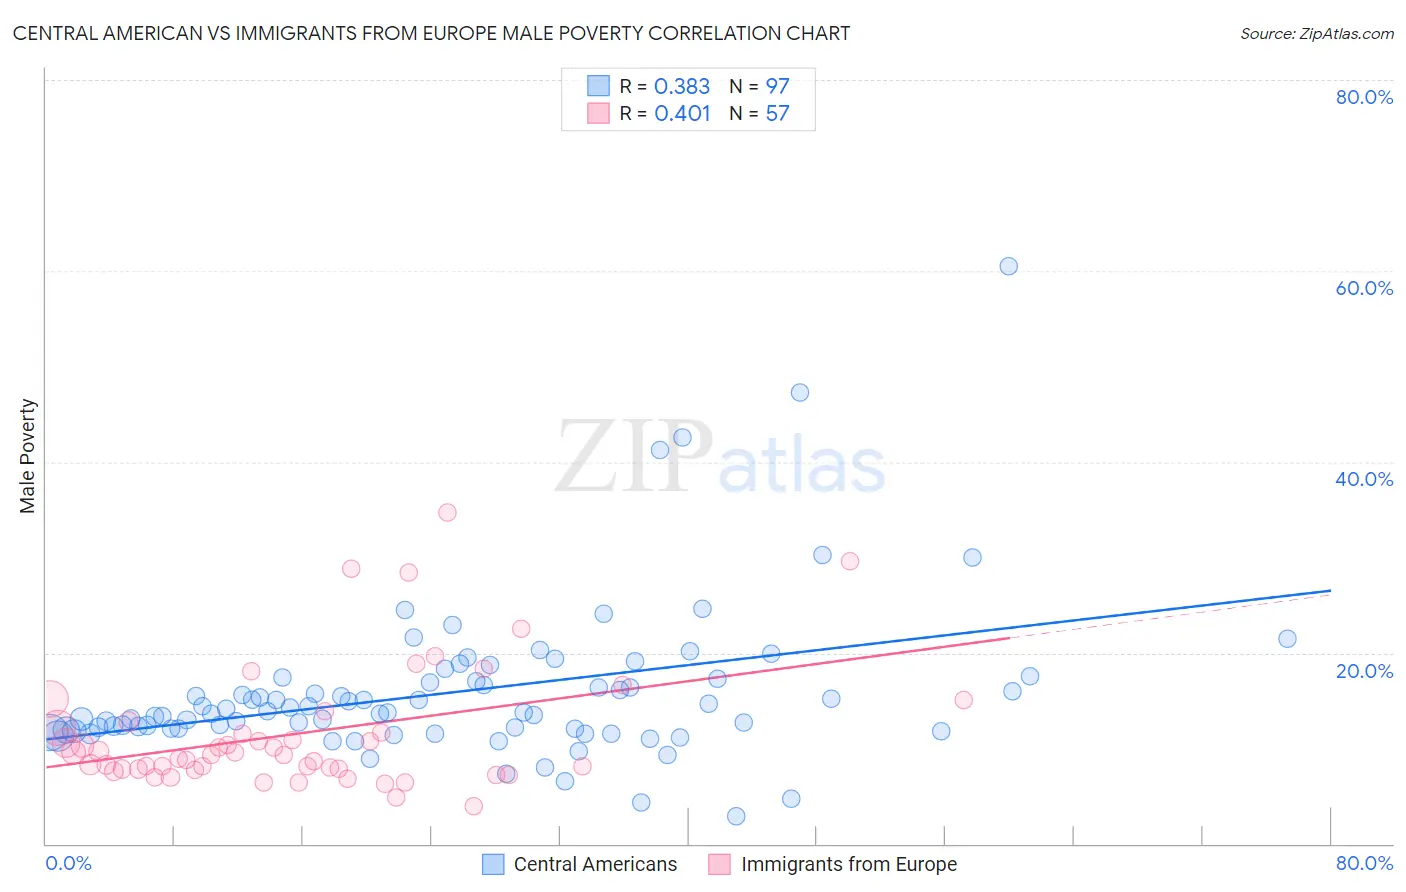
Central American vs Immigrants from Europe Male Poverty Correlation Chart
The statistical analysis conducted on geographies consisting of 503,856,624 people shows a mild positive correlation between the proportion of Central Americans and poverty level among males in the United States with a correlation coefficient (R) of 0.383 and weighted average of 13.2%. Similarly, the statistical analysis conducted on geographies consisting of 546,187,630 people shows a moderate positive correlation between the proportion of Immigrants from Europe and poverty level among males in the United States with a correlation coefficient (R) of 0.401 and weighted average of 10.1%, a difference of 29.9%.
Male Poverty Correlation Summary
| Measurement | Central American | Immigrants from Europe |
| Minimum | 2.9% | 4.0% |
| Maximum | 60.5% | 34.6% |
| Range | 57.6% | 30.6% |
| Mean | 15.9% | 11.6% |
| Median | 13.7% | 9.3% |
| Interquartile 25% (IQ1) | 12.0% | 7.8% |
| Interquartile 75% (IQ3) | 17.2% | 12.5% |
| Interquartile Range (IQR) | 5.2% | 4.7% |
| Standard Deviation (Sample) | 8.3% | 6.5% |
| Standard Deviation (Population) | 8.2% | 6.4% |
Similar Demographics by Male Poverty
Demographics Similar to Central Americans by Male Poverty
In terms of male poverty, the demographic groups most similar to Central Americans are Iroquois (13.2%, a difference of 0.36%), Jamaican (13.2%, a difference of 0.38%), Spanish American Indian (13.1%, a difference of 0.40%), Trinidadian and Tobagonian (13.1%, a difference of 0.45%), and Ottawa (13.1%, a difference of 0.47%).
| Demographics | Rating | Rank | Male Poverty |
| Immigrants | Burma/Myanmar | 0.1 /100 | #256 | Tragic 13.0% |
| Immigrants | Trinidad and Tobago | 0.1 /100 | #257 | Tragic 13.1% |
| Cape Verdeans | 0.1 /100 | #258 | Tragic 13.1% |
| Cherokee | 0.1 /100 | #259 | Tragic 13.1% |
| Ottawa | 0.1 /100 | #260 | Tragic 13.1% |
| Trinidadians and Tobagonians | 0.1 /100 | #261 | Tragic 13.1% |
| Spanish American Indians | 0.1 /100 | #262 | Tragic 13.1% |
| Central Americans | 0.1 /100 | #263 | Tragic 13.2% |
| Iroquois | 0.1 /100 | #264 | Tragic 13.2% |
| Jamaicans | 0.1 /100 | #265 | Tragic 13.2% |
| Immigrants | Guyana | 0.1 /100 | #266 | Tragic 13.2% |
| Immigrants | Jamaica | 0.1 /100 | #267 | Tragic 13.3% |
| Sub-Saharan Africans | 0.1 /100 | #268 | Tragic 13.3% |
| Guyanese | 0.0 /100 | #269 | Tragic 13.3% |
| Cree | 0.0 /100 | #270 | Tragic 13.3% |
Demographics Similar to Immigrants from Europe by Male Poverty
In terms of male poverty, the demographic groups most similar to Immigrants from Europe are Ukrainian (10.1%, a difference of 0.090%), Austrian (10.1%, a difference of 0.11%), Scandinavian (10.1%, a difference of 0.13%), Immigrants from Italy (10.2%, a difference of 0.20%), and Estonian (10.1%, a difference of 0.21%).
| Demographics | Rating | Rank | Male Poverty |
| Asians | 98.7 /100 | #52 | Exceptional 10.0% |
| Immigrants | Czechoslovakia | 98.6 /100 | #53 | Exceptional 10.0% |
| Immigrants | Austria | 98.5 /100 | #54 | Exceptional 10.0% |
| Germans | 98.3 /100 | #55 | Exceptional 10.1% |
| Immigrants | Bulgaria | 98.2 /100 | #56 | Exceptional 10.1% |
| Estonians | 98.1 /100 | #57 | Exceptional 10.1% |
| Scandinavians | 98.0 /100 | #58 | Exceptional 10.1% |
| Immigrants | Europe | 97.9 /100 | #59 | Exceptional 10.1% |
| Ukrainians | 97.9 /100 | #60 | Exceptional 10.1% |
| Austrians | 97.8 /100 | #61 | Exceptional 10.1% |
| Immigrants | Italy | 97.8 /100 | #62 | Exceptional 10.2% |
| Slovaks | 97.7 /100 | #63 | Exceptional 10.2% |
| Swiss | 97.5 /100 | #64 | Exceptional 10.2% |
| Zimbabweans | 97.5 /100 | #65 | Exceptional 10.2% |
| Serbians | 97.5 /100 | #66 | Exceptional 10.2% |