Central American vs Immigrants from Eastern Europe Unemployment Among Women with Children Under 6 years
COMPARE
Central American
Immigrants from Eastern Europe
Unemployment Among Women with Children Under 6 years
Unemployment Among Women with Children Under 6 years Comparison
Central Americans
Immigrants from Eastern Europe
8.2%
UNEMPLOYMENT AMONG WOMEN WITH CHILDREN UNDER 6 YEARS
1.4/ 100
METRIC RATING
246th/ 347
METRIC RANK
7.1%
UNEMPLOYMENT AMONG WOMEN WITH CHILDREN UNDER 6 YEARS
99.0/ 100
METRIC RATING
75th/ 347
METRIC RANK
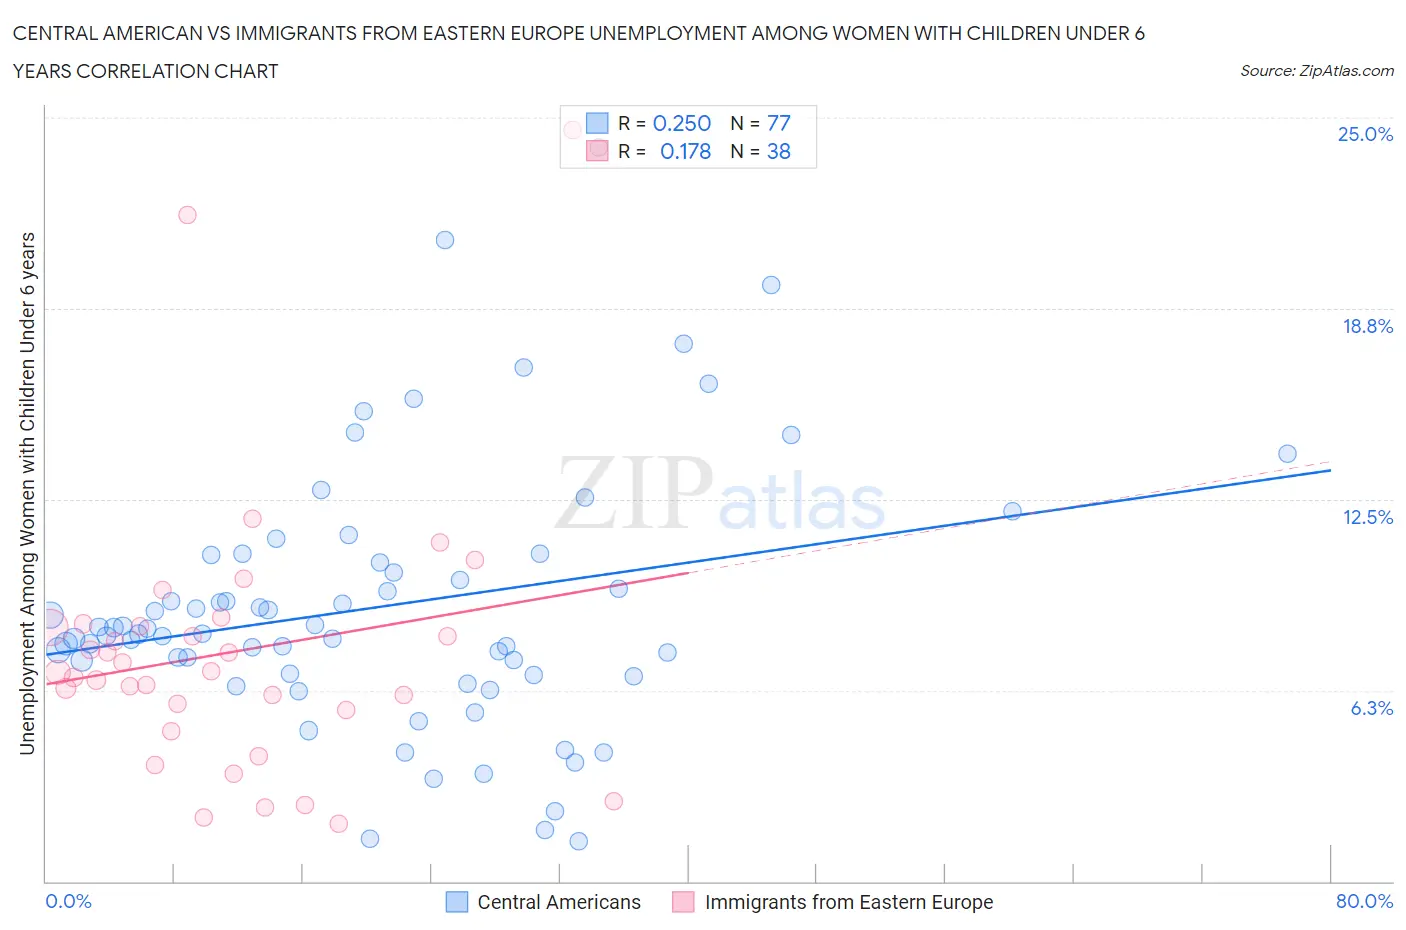
Central American vs Immigrants from Eastern Europe Unemployment Among Women with Children Under 6 years Correlation Chart
The statistical analysis conducted on geographies consisting of 361,380,642 people shows a weak positive correlation between the proportion of Central Americans and unemployment rate among women with children under the age of 6 in the United States with a correlation coefficient (R) of 0.250 and weighted average of 8.2%. Similarly, the statistical analysis conducted on geographies consisting of 341,063,279 people shows a poor positive correlation between the proportion of Immigrants from Eastern Europe and unemployment rate among women with children under the age of 6 in the United States with a correlation coefficient (R) of 0.178 and weighted average of 7.1%, a difference of 15.8%.
Unemployment Among Women with Children Under 6 years Correlation Summary
| Measurement | Central American | Immigrants from Eastern Europe |
| Minimum | 1.3% | 1.9% |
| Maximum | 24.0% | 24.6% |
| Range | 22.7% | 22.7% |
| Mean | 9.0% | 7.5% |
| Median | 8.1% | 6.9% |
| Interquartile 25% (IQ1) | 6.8% | 5.6% |
| Interquartile 75% (IQ3) | 10.5% | 8.3% |
| Interquartile Range (IQR) | 3.8% | 2.7% |
| Standard Deviation (Sample) | 4.3% | 4.5% |
| Standard Deviation (Population) | 4.3% | 4.4% |
Similar Demographics by Unemployment Among Women with Children Under 6 years
Demographics Similar to Central Americans by Unemployment Among Women with Children Under 6 years
In terms of unemployment among women with children under 6 years, the demographic groups most similar to Central Americans are German Russian (8.2%, a difference of 0.28%), Immigrants from Western Africa (8.2%, a difference of 0.32%), Native Hawaiian (8.2%, a difference of 0.33%), French (8.2%, a difference of 0.34%), and Hawaiian (8.2%, a difference of 0.37%).
| Demographics | Rating | Rank | Unemployment Among Women with Children Under 6 years |
| Irish | 2.7 /100 | #239 | Tragic 8.1% |
| Immigrants | El Salvador | 2.6 /100 | #240 | Tragic 8.1% |
| Liberians | 2.6 /100 | #241 | Tragic 8.1% |
| Dutch | 2.5 /100 | #242 | Tragic 8.1% |
| Hawaiians | 1.8 /100 | #243 | Tragic 8.2% |
| French | 1.7 /100 | #244 | Tragic 8.2% |
| Native Hawaiians | 1.7 /100 | #245 | Tragic 8.2% |
| Central Americans | 1.4 /100 | #246 | Tragic 8.2% |
| German Russians | 1.2 /100 | #247 | Tragic 8.2% |
| Immigrants | Western Africa | 1.1 /100 | #248 | Tragic 8.2% |
| Immigrants | Sierra Leone | 1.1 /100 | #249 | Tragic 8.2% |
| Nigerians | 1.1 /100 | #250 | Tragic 8.2% |
| Guyanese | 1.0 /100 | #251 | Tragic 8.2% |
| Ghanaians | 1.0 /100 | #252 | Tragic 8.2% |
| Immigrants | Guyana | 0.8 /100 | #253 | Tragic 8.2% |
Demographics Similar to Immigrants from Eastern Europe by Unemployment Among Women with Children Under 6 years
In terms of unemployment among women with children under 6 years, the demographic groups most similar to Immigrants from Eastern Europe are Estonian (7.1%, a difference of 0.050%), Immigrants from Croatia (7.1%, a difference of 0.080%), Immigrants from Somalia (7.1%, a difference of 0.12%), Immigrants from Fiji (7.1%, a difference of 0.17%), and Immigrants from Greece (7.1%, a difference of 0.20%).
| Demographics | Rating | Rank | Unemployment Among Women with Children Under 6 years |
| Paraguayans | 99.4 /100 | #68 | Exceptional 7.0% |
| Immigrants | Eritrea | 99.4 /100 | #69 | Exceptional 7.0% |
| Immigrants | Iraq | 99.4 /100 | #70 | Exceptional 7.0% |
| Afghans | 99.4 /100 | #71 | Exceptional 7.0% |
| Cubans | 99.4 /100 | #72 | Exceptional 7.0% |
| Immigrants | Czechoslovakia | 99.2 /100 | #73 | Exceptional 7.0% |
| Turks | 99.2 /100 | #74 | Exceptional 7.0% |
| Immigrants | Eastern Europe | 99.0 /100 | #75 | Exceptional 7.1% |
| Estonians | 99.0 /100 | #76 | Exceptional 7.1% |
| Immigrants | Croatia | 98.9 /100 | #77 | Exceptional 7.1% |
| Immigrants | Somalia | 98.9 /100 | #78 | Exceptional 7.1% |
| Immigrants | Fiji | 98.9 /100 | #79 | Exceptional 7.1% |
| Immigrants | Greece | 98.9 /100 | #80 | Exceptional 7.1% |
| Immigrants | Venezuela | 98.8 /100 | #81 | Exceptional 7.1% |
| Immigrants | Afghanistan | 98.7 /100 | #82 | Exceptional 7.1% |