Central American vs Immigrants from Eastern Europe Associate's Degree
COMPARE
Central American
Immigrants from Eastern Europe
Associate's Degree
Associate's Degree Comparison
Central Americans
Immigrants from Eastern Europe
39.4%
ASSOCIATE'S DEGREE
0.0/ 100
METRIC RATING
289th/ 347
METRIC RANK
50.5%
ASSOCIATE'S DEGREE
99.1/ 100
METRIC RATING
78th/ 347
METRIC RANK
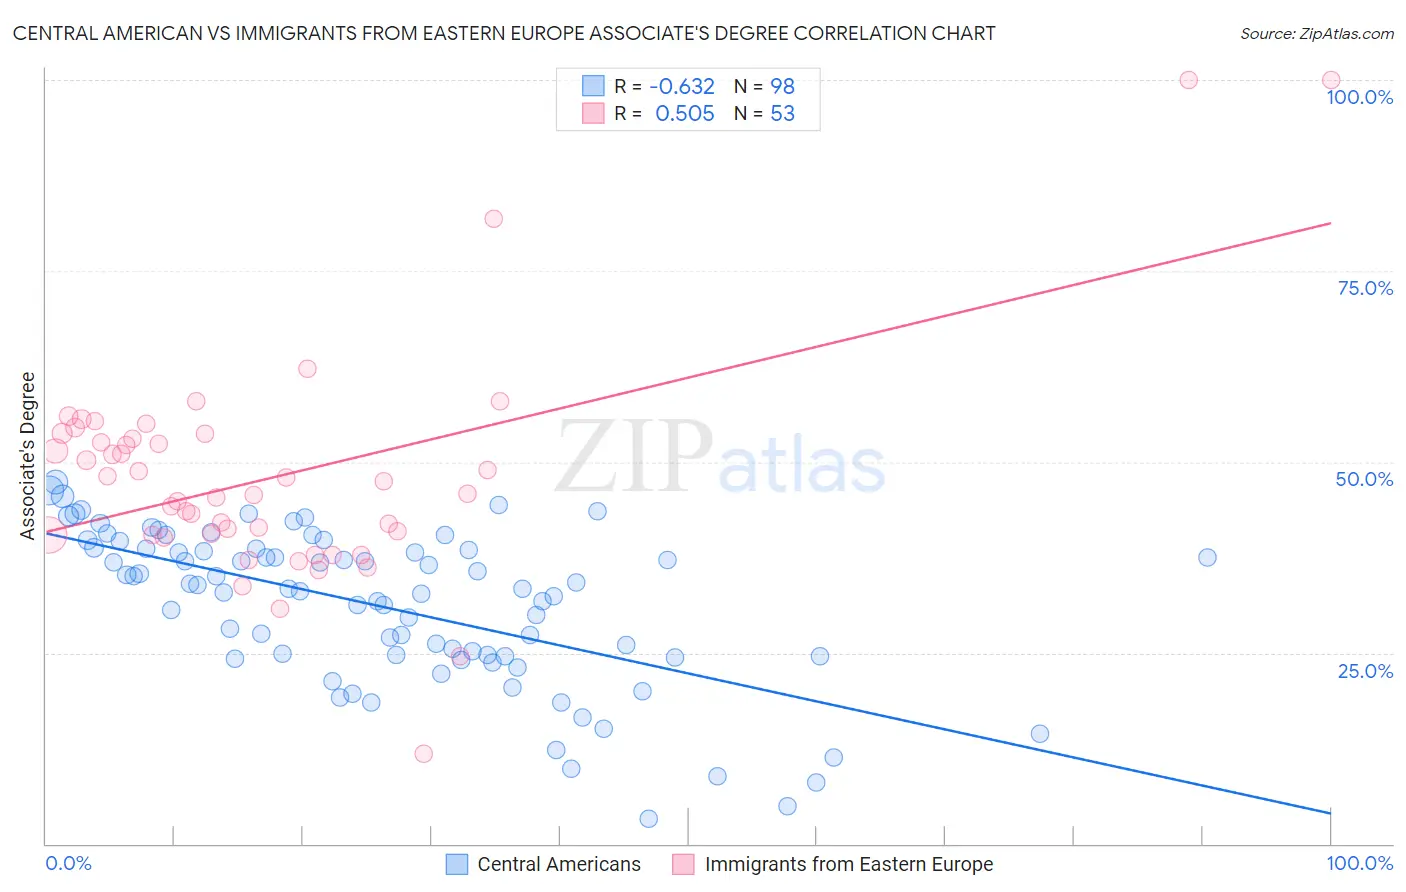
Central American vs Immigrants from Eastern Europe Associate's Degree Correlation Chart
The statistical analysis conducted on geographies consisting of 504,559,402 people shows a significant negative correlation between the proportion of Central Americans and percentage of population with at least associate's degree education in the United States with a correlation coefficient (R) of -0.632 and weighted average of 39.4%. Similarly, the statistical analysis conducted on geographies consisting of 475,831,649 people shows a substantial positive correlation between the proportion of Immigrants from Eastern Europe and percentage of population with at least associate's degree education in the United States with a correlation coefficient (R) of 0.505 and weighted average of 50.5%, a difference of 27.9%.
Associate's Degree Correlation Summary
| Measurement | Central American | Immigrants from Eastern Europe |
| Minimum | 3.3% | 11.8% |
| Maximum | 47.4% | 100.0% |
| Range | 44.0% | 88.2% |
| Mean | 31.1% | 47.9% |
| Median | 33.4% | 45.8% |
| Interquartile 25% (IQ1) | 24.6% | 40.4% |
| Interquartile 75% (IQ3) | 38.6% | 53.3% |
| Interquartile Range (IQR) | 14.0% | 12.9% |
| Standard Deviation (Sample) | 10.1% | 14.6% |
| Standard Deviation (Population) | 10.0% | 14.5% |
Similar Demographics by Associate's Degree
Demographics Similar to Central Americans by Associate's Degree
In terms of associate's degree, the demographic groups most similar to Central Americans are Immigrants from Cuba (39.5%, a difference of 0.26%), Immigrants from Haiti (39.3%, a difference of 0.44%), Dominican (39.3%, a difference of 0.46%), Aleut (39.6%, a difference of 0.50%), and Black/African American (39.1%, a difference of 0.75%).
| Demographics | Rating | Rank | Associate's Degree |
| Bangladeshis | 0.1 /100 | #282 | Tragic 40.0% |
| Haitians | 0.1 /100 | #283 | Tragic 40.0% |
| Comanche | 0.1 /100 | #284 | Tragic 39.9% |
| Immigrants | Belize | 0.1 /100 | #285 | Tragic 39.9% |
| Immigrants | Caribbean | 0.0 /100 | #286 | Tragic 39.7% |
| Aleuts | 0.0 /100 | #287 | Tragic 39.6% |
| Immigrants | Cuba | 0.0 /100 | #288 | Tragic 39.5% |
| Central Americans | 0.0 /100 | #289 | Tragic 39.4% |
| Immigrants | Haiti | 0.0 /100 | #290 | Tragic 39.3% |
| Dominicans | 0.0 /100 | #291 | Tragic 39.3% |
| Blacks/African Americans | 0.0 /100 | #292 | Tragic 39.1% |
| Nepalese | 0.0 /100 | #293 | Tragic 39.0% |
| Salvadorans | 0.0 /100 | #294 | Tragic 39.0% |
| Hondurans | 0.0 /100 | #295 | Tragic 38.9% |
| Cherokee | 0.0 /100 | #296 | Tragic 38.9% |
Demographics Similar to Immigrants from Eastern Europe by Associate's Degree
In terms of associate's degree, the demographic groups most similar to Immigrants from Eastern Europe are Ethiopian (50.4%, a difference of 0.010%), Immigrants from Lebanon (50.5%, a difference of 0.040%), Armenian (50.4%, a difference of 0.050%), Immigrants from Zimbabwe (50.5%, a difference of 0.080%), and Maltese (50.4%, a difference of 0.12%).
| Demographics | Rating | Rank | Associate's Degree |
| Immigrants | Romania | 99.5 /100 | #71 | Exceptional 50.9% |
| Immigrants | Pakistan | 99.5 /100 | #72 | Exceptional 50.9% |
| Carpatho Rusyns | 99.3 /100 | #73 | Exceptional 50.6% |
| Lithuanians | 99.3 /100 | #74 | Exceptional 50.6% |
| Immigrants | Scotland | 99.3 /100 | #75 | Exceptional 50.6% |
| Immigrants | Zimbabwe | 99.2 /100 | #76 | Exceptional 50.5% |
| Immigrants | Lebanon | 99.1 /100 | #77 | Exceptional 50.5% |
| Immigrants | Eastern Europe | 99.1 /100 | #78 | Exceptional 50.5% |
| Ethiopians | 99.1 /100 | #79 | Exceptional 50.4% |
| Armenians | 99.1 /100 | #80 | Exceptional 50.4% |
| Maltese | 99.1 /100 | #81 | Exceptional 50.4% |
| Greeks | 98.9 /100 | #82 | Exceptional 50.3% |
| Immigrants | Uzbekistan | 98.9 /100 | #83 | Exceptional 50.3% |
| Immigrants | Hungary | 98.9 /100 | #84 | Exceptional 50.2% |
| Immigrants | Egypt | 98.9 /100 | #85 | Exceptional 50.2% |