Central American Indian vs Immigrants from Ukraine Seniors Poverty Over the Age of 75
COMPARE
Central American Indian
Immigrants from Ukraine
Seniors Poverty Over the Age of 75
Seniors Poverty Over the Age of 75 Comparison
Central American Indians
Immigrants from Ukraine
16.5%
SENIORS POVERTY OVER THE AGE OF 75
0.0/ 100
METRIC RATING
323rd/ 347
METRIC RANK
13.6%
SENIORS POVERTY OVER THE AGE OF 75
0.3/ 100
METRIC RATING
247th/ 347
METRIC RANK
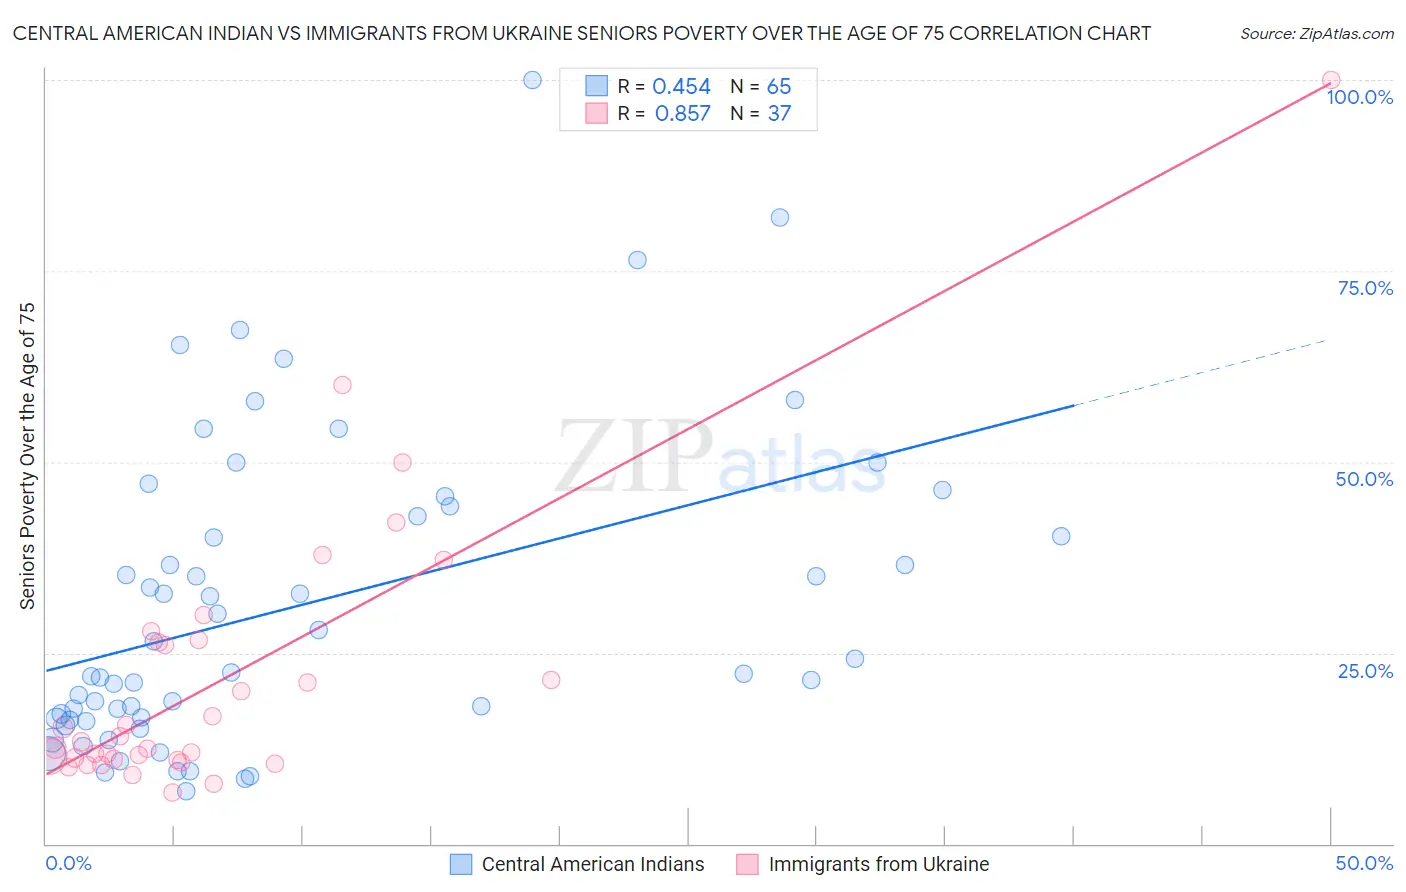
Central American Indian vs Immigrants from Ukraine Seniors Poverty Over the Age of 75 Correlation Chart
The statistical analysis conducted on geographies consisting of 323,772,656 people shows a moderate positive correlation between the proportion of Central American Indians and poverty level among seniors over the age of 75 in the United States with a correlation coefficient (R) of 0.454 and weighted average of 16.5%. Similarly, the statistical analysis conducted on geographies consisting of 287,069,845 people shows a very strong positive correlation between the proportion of Immigrants from Ukraine and poverty level among seniors over the age of 75 in the United States with a correlation coefficient (R) of 0.857 and weighted average of 13.6%, a difference of 21.6%.
Seniors Poverty Over the Age of 75 Correlation Summary
| Measurement | Central American Indian | Immigrants from Ukraine |
| Minimum | 6.9% | 6.7% |
| Maximum | 100.0% | 100.0% |
| Range | 93.1% | 93.3% |
| Mean | 31.1% | 21.4% |
| Median | 22.4% | 13.4% |
| Interquartile 25% (IQ1) | 16.4% | 11.0% |
| Interquartile 75% (IQ3) | 43.5% | 26.5% |
| Interquartile Range (IQR) | 27.1% | 15.5% |
| Standard Deviation (Sample) | 20.1% | 18.2% |
| Standard Deviation (Population) | 20.0% | 18.0% |
Similar Demographics by Seniors Poverty Over the Age of 75
Demographics Similar to Central American Indians by Seniors Poverty Over the Age of 75
In terms of seniors poverty over the age of 75, the demographic groups most similar to Central American Indians are Immigrants from Uzbekistan (16.5%, a difference of 0.050%), Immigrants from Barbados (16.5%, a difference of 0.090%), Immigrants from Haiti (16.5%, a difference of 0.11%), Immigrants from Yemen (16.5%, a difference of 0.30%), and Nicaraguan (16.6%, a difference of 0.43%).
| Demographics | Rating | Rank | Seniors Poverty Over the Age of 75 |
| Immigrants | Ecuador | 0.0 /100 | #316 | Tragic 16.1% |
| Immigrants | Guyana | 0.0 /100 | #317 | Tragic 16.2% |
| Houma | 0.0 /100 | #318 | Tragic 16.2% |
| Haitians | 0.0 /100 | #319 | Tragic 16.2% |
| Immigrants | Yemen | 0.0 /100 | #320 | Tragic 16.5% |
| Immigrants | Haiti | 0.0 /100 | #321 | Tragic 16.5% |
| Immigrants | Barbados | 0.0 /100 | #322 | Tragic 16.5% |
| Central American Indians | 0.0 /100 | #323 | Tragic 16.5% |
| Immigrants | Uzbekistan | 0.0 /100 | #324 | Tragic 16.5% |
| Nicaraguans | 0.0 /100 | #325 | Tragic 16.6% |
| Pueblo | 0.0 /100 | #326 | Tragic 16.7% |
| Sioux | 0.0 /100 | #327 | Tragic 16.8% |
| Cape Verdeans | 0.0 /100 | #328 | Tragic 16.8% |
| Immigrants | Dominica | 0.0 /100 | #329 | Tragic 17.0% |
| British West Indians | 0.0 /100 | #330 | Tragic 17.4% |
Demographics Similar to Immigrants from Ukraine by Seniors Poverty Over the Age of 75
In terms of seniors poverty over the age of 75, the demographic groups most similar to Immigrants from Ukraine are African (13.6%, a difference of 0.030%), Immigrants from Albania (13.6%, a difference of 0.040%), Mexican American Indian (13.6%, a difference of 0.050%), Immigrants from Peru (13.7%, a difference of 0.38%), and Immigrants from Cambodia (13.6%, a difference of 0.40%).
| Demographics | Rating | Rank | Seniors Poverty Over the Age of 75 |
| Argentineans | 0.7 /100 | #240 | Tragic 13.4% |
| Immigrants | Russia | 0.6 /100 | #241 | Tragic 13.4% |
| Immigrants | Somalia | 0.6 /100 | #242 | Tragic 13.5% |
| Dutch West Indians | 0.6 /100 | #243 | Tragic 13.5% |
| Spanish Americans | 0.5 /100 | #244 | Tragic 13.5% |
| Uruguayans | 0.5 /100 | #245 | Tragic 13.5% |
| Immigrants | Cambodia | 0.4 /100 | #246 | Tragic 13.6% |
| Immigrants | Ukraine | 0.3 /100 | #247 | Tragic 13.6% |
| Africans | 0.3 /100 | #248 | Tragic 13.6% |
| Immigrants | Albania | 0.3 /100 | #249 | Tragic 13.6% |
| Mexican American Indians | 0.3 /100 | #250 | Tragic 13.6% |
| Immigrants | Peru | 0.3 /100 | #251 | Tragic 13.7% |
| Immigrants | Argentina | 0.3 /100 | #252 | Tragic 13.7% |
| Immigrants | Spain | 0.2 /100 | #253 | Tragic 13.7% |
| Blackfeet | 0.2 /100 | #254 | Tragic 13.7% |