Central American Indian vs Celtic Seniors Poverty Over the Age of 75
COMPARE
Central American Indian
Celtic
Seniors Poverty Over the Age of 75
Seniors Poverty Over the Age of 75 Comparison
Central American Indians
Celtics
16.5%
SENIORS POVERTY OVER THE AGE OF 75
0.0/ 100
METRIC RATING
323rd/ 347
METRIC RANK
11.0%
SENIORS POVERTY OVER THE AGE OF 75
99.1/ 100
METRIC RATING
43rd/ 347
METRIC RANK
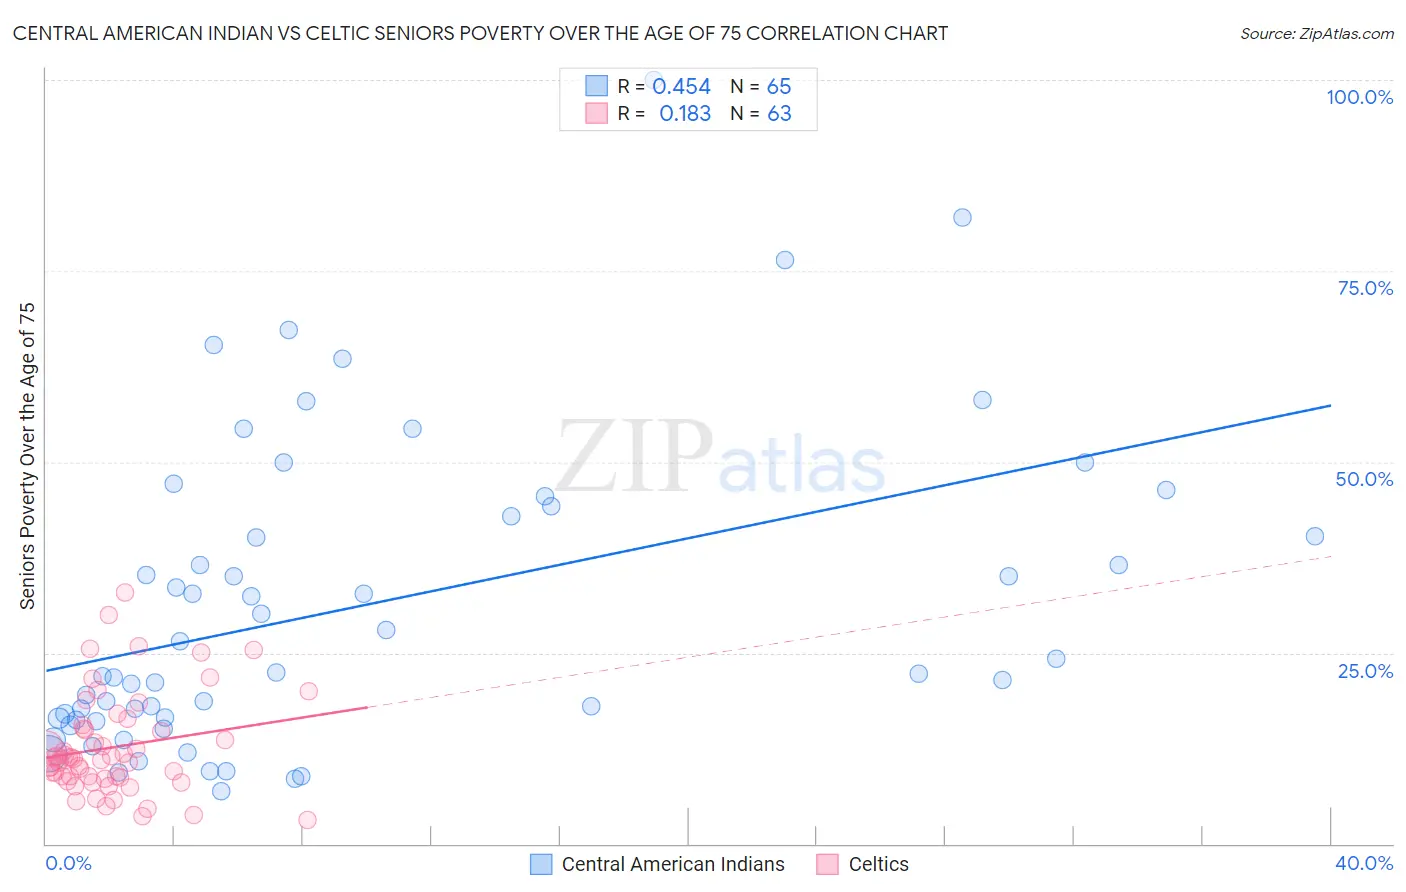
Central American Indian vs Celtic Seniors Poverty Over the Age of 75 Correlation Chart
The statistical analysis conducted on geographies consisting of 323,772,656 people shows a moderate positive correlation between the proportion of Central American Indians and poverty level among seniors over the age of 75 in the United States with a correlation coefficient (R) of 0.454 and weighted average of 16.5%. Similarly, the statistical analysis conducted on geographies consisting of 167,925,016 people shows a poor positive correlation between the proportion of Celtics and poverty level among seniors over the age of 75 in the United States with a correlation coefficient (R) of 0.183 and weighted average of 11.0%, a difference of 50.1%.
Seniors Poverty Over the Age of 75 Correlation Summary
| Measurement | Central American Indian | Celtic |
| Minimum | 6.9% | 3.2% |
| Maximum | 100.0% | 32.9% |
| Range | 93.1% | 29.8% |
| Mean | 31.1% | 12.6% |
| Median | 22.4% | 11.1% |
| Interquartile 25% (IQ1) | 16.4% | 8.7% |
| Interquartile 75% (IQ3) | 43.5% | 15.0% |
| Interquartile Range (IQR) | 27.1% | 6.3% |
| Standard Deviation (Sample) | 20.1% | 6.5% |
| Standard Deviation (Population) | 20.0% | 6.4% |
Similar Demographics by Seniors Poverty Over the Age of 75
Demographics Similar to Central American Indians by Seniors Poverty Over the Age of 75
In terms of seniors poverty over the age of 75, the demographic groups most similar to Central American Indians are Immigrants from Uzbekistan (16.5%, a difference of 0.050%), Immigrants from Barbados (16.5%, a difference of 0.090%), Immigrants from Haiti (16.5%, a difference of 0.11%), Immigrants from Yemen (16.5%, a difference of 0.30%), and Nicaraguan (16.6%, a difference of 0.43%).
| Demographics | Rating | Rank | Seniors Poverty Over the Age of 75 |
| Immigrants | Ecuador | 0.0 /100 | #316 | Tragic 16.1% |
| Immigrants | Guyana | 0.0 /100 | #317 | Tragic 16.2% |
| Houma | 0.0 /100 | #318 | Tragic 16.2% |
| Haitians | 0.0 /100 | #319 | Tragic 16.2% |
| Immigrants | Yemen | 0.0 /100 | #320 | Tragic 16.5% |
| Immigrants | Haiti | 0.0 /100 | #321 | Tragic 16.5% |
| Immigrants | Barbados | 0.0 /100 | #322 | Tragic 16.5% |
| Central American Indians | 0.0 /100 | #323 | Tragic 16.5% |
| Immigrants | Uzbekistan | 0.0 /100 | #324 | Tragic 16.5% |
| Nicaraguans | 0.0 /100 | #325 | Tragic 16.6% |
| Pueblo | 0.0 /100 | #326 | Tragic 16.7% |
| Sioux | 0.0 /100 | #327 | Tragic 16.8% |
| Cape Verdeans | 0.0 /100 | #328 | Tragic 16.8% |
| Immigrants | Dominica | 0.0 /100 | #329 | Tragic 17.0% |
| British West Indians | 0.0 /100 | #330 | Tragic 17.4% |
Demographics Similar to Celtics by Seniors Poverty Over the Age of 75
In terms of seniors poverty over the age of 75, the demographic groups most similar to Celtics are Belgian (11.0%, a difference of 0.030%), Austrian (11.0%, a difference of 0.050%), Carpatho Rusyn (11.1%, a difference of 0.30%), Immigrants from Lithuania (11.0%, a difference of 0.32%), and Greek (11.1%, a difference of 0.36%).
| Demographics | Rating | Rank | Seniors Poverty Over the Age of 75 |
| Scotch-Irish | 99.6 /100 | #36 | Exceptional 10.8% |
| Latvians | 99.6 /100 | #37 | Exceptional 10.8% |
| Finns | 99.6 /100 | #38 | Exceptional 10.8% |
| Czechoslovakians | 99.4 /100 | #39 | Exceptional 10.9% |
| Thais | 99.4 /100 | #40 | Exceptional 10.9% |
| Immigrants | Lithuania | 99.2 /100 | #41 | Exceptional 11.0% |
| Austrians | 99.1 /100 | #42 | Exceptional 11.0% |
| Celtics | 99.1 /100 | #43 | Exceptional 11.0% |
| Belgians | 99.1 /100 | #44 | Exceptional 11.0% |
| Carpatho Rusyns | 99.0 /100 | #45 | Exceptional 11.1% |
| Greeks | 99.0 /100 | #46 | Exceptional 11.1% |
| Hawaiians | 98.8 /100 | #47 | Exceptional 11.1% |
| French | 98.7 /100 | #48 | Exceptional 11.1% |
| Samoans | 98.7 /100 | #49 | Exceptional 11.1% |
| Serbians | 98.6 /100 | #50 | Exceptional 11.1% |