Scottish vs Immigrants from Ukraine Seniors Poverty Over the Age of 75
COMPARE
Scottish
Immigrants from Ukraine
Seniors Poverty Over the Age of 75
Seniors Poverty Over the Age of 75 Comparison
Scottish
Immigrants from Ukraine
10.5%
SENIORS POVERTY OVER THE AGE OF 75
99.9/ 100
METRIC RATING
14th/ 347
METRIC RANK
13.6%
SENIORS POVERTY OVER THE AGE OF 75
0.3/ 100
METRIC RATING
247th/ 347
METRIC RANK
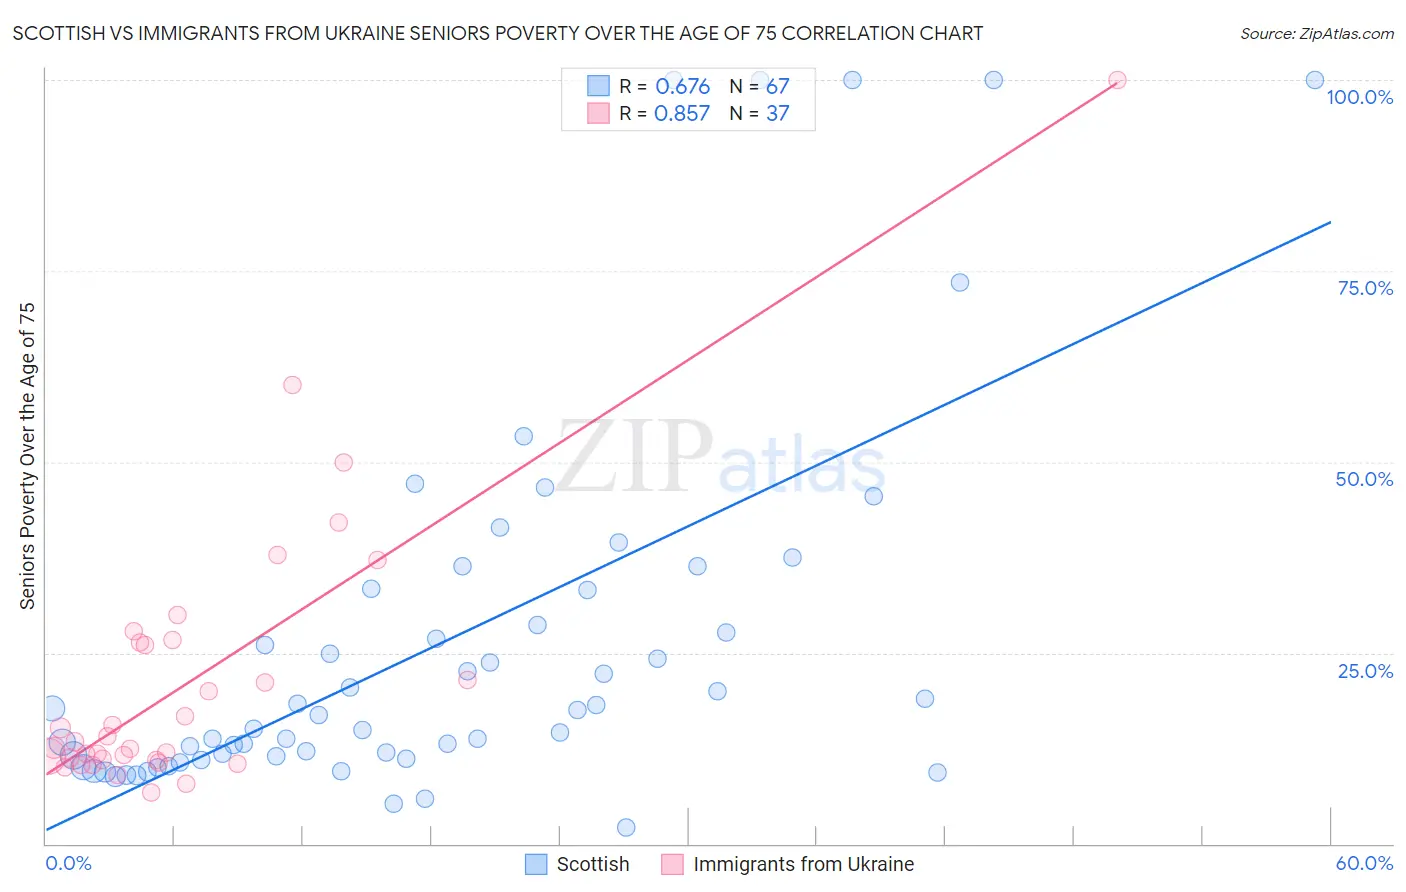
Scottish vs Immigrants from Ukraine Seniors Poverty Over the Age of 75 Correlation Chart
The statistical analysis conducted on geographies consisting of 550,180,944 people shows a significant positive correlation between the proportion of Scottish and poverty level among seniors over the age of 75 in the United States with a correlation coefficient (R) of 0.676 and weighted average of 10.5%. Similarly, the statistical analysis conducted on geographies consisting of 287,069,845 people shows a very strong positive correlation between the proportion of Immigrants from Ukraine and poverty level among seniors over the age of 75 in the United States with a correlation coefficient (R) of 0.857 and weighted average of 13.6%, a difference of 29.5%.
Seniors Poverty Over the Age of 75 Correlation Summary
| Measurement | Scottish | Immigrants from Ukraine |
| Minimum | 2.1% | 6.7% |
| Maximum | 100.0% | 100.0% |
| Range | 97.9% | 93.3% |
| Mean | 26.2% | 21.4% |
| Median | 16.8% | 13.4% |
| Interquartile 25% (IQ1) | 11.1% | 11.0% |
| Interquartile 75% (IQ3) | 33.2% | 26.5% |
| Interquartile Range (IQR) | 22.1% | 15.5% |
| Standard Deviation (Sample) | 24.9% | 18.2% |
| Standard Deviation (Population) | 24.7% | 18.0% |
Similar Demographics by Seniors Poverty Over the Age of 75
Demographics Similar to Scottish by Seniors Poverty Over the Age of 75
In terms of seniors poverty over the age of 75, the demographic groups most similar to Scottish are European (10.5%, a difference of 0.0%), Dutch (10.5%, a difference of 0.12%), Croatian (10.5%, a difference of 0.15%), Tongan (10.5%, a difference of 0.25%), and Slovak (10.5%, a difference of 0.32%).
| Demographics | Rating | Rank | Seniors Poverty Over the Age of 75 |
| Maltese | 100.0 /100 | #7 | Exceptional 10.3% |
| Germans | 99.9 /100 | #8 | Exceptional 10.4% |
| English | 99.9 /100 | #9 | Exceptional 10.4% |
| Scandinavians | 99.9 /100 | #10 | Exceptional 10.4% |
| Immigrants | India | 99.9 /100 | #11 | Exceptional 10.4% |
| Tongans | 99.9 /100 | #12 | Exceptional 10.5% |
| Croatians | 99.9 /100 | #13 | Exceptional 10.5% |
| Scottish | 99.9 /100 | #14 | Exceptional 10.5% |
| Europeans | 99.9 /100 | #15 | Exceptional 10.5% |
| Dutch | 99.9 /100 | #16 | Exceptional 10.5% |
| Slovaks | 99.9 /100 | #17 | Exceptional 10.5% |
| Welsh | 99.9 /100 | #18 | Exceptional 10.5% |
| Immigrants | Scotland | 99.9 /100 | #19 | Exceptional 10.5% |
| Czechs | 99.9 /100 | #20 | Exceptional 10.5% |
| Slovenes | 99.9 /100 | #21 | Exceptional 10.6% |
Demographics Similar to Immigrants from Ukraine by Seniors Poverty Over the Age of 75
In terms of seniors poverty over the age of 75, the demographic groups most similar to Immigrants from Ukraine are African (13.6%, a difference of 0.030%), Immigrants from Albania (13.6%, a difference of 0.040%), Mexican American Indian (13.6%, a difference of 0.050%), Immigrants from Peru (13.7%, a difference of 0.38%), and Immigrants from Cambodia (13.6%, a difference of 0.40%).
| Demographics | Rating | Rank | Seniors Poverty Over the Age of 75 |
| Argentineans | 0.7 /100 | #240 | Tragic 13.4% |
| Immigrants | Russia | 0.6 /100 | #241 | Tragic 13.4% |
| Immigrants | Somalia | 0.6 /100 | #242 | Tragic 13.5% |
| Dutch West Indians | 0.6 /100 | #243 | Tragic 13.5% |
| Spanish Americans | 0.5 /100 | #244 | Tragic 13.5% |
| Uruguayans | 0.5 /100 | #245 | Tragic 13.5% |
| Immigrants | Cambodia | 0.4 /100 | #246 | Tragic 13.6% |
| Immigrants | Ukraine | 0.3 /100 | #247 | Tragic 13.6% |
| Africans | 0.3 /100 | #248 | Tragic 13.6% |
| Immigrants | Albania | 0.3 /100 | #249 | Tragic 13.6% |
| Mexican American Indians | 0.3 /100 | #250 | Tragic 13.6% |
| Immigrants | Peru | 0.3 /100 | #251 | Tragic 13.7% |
| Immigrants | Argentina | 0.3 /100 | #252 | Tragic 13.7% |
| Immigrants | Spain | 0.2 /100 | #253 | Tragic 13.7% |
| Blackfeet | 0.2 /100 | #254 | Tragic 13.7% |