Central American Indian vs Immigrants from Trinidad and Tobago Seniors Poverty Over the Age of 75
COMPARE
Central American Indian
Immigrants from Trinidad and Tobago
Seniors Poverty Over the Age of 75
Seniors Poverty Over the Age of 75 Comparison
Central American Indians
Immigrants from Trinidad and Tobago
16.5%
SENIORS POVERTY OVER THE AGE OF 75
0.0/ 100
METRIC RATING
323rd/ 347
METRIC RANK
15.7%
SENIORS POVERTY OVER THE AGE OF 75
0.0/ 100
METRIC RATING
304th/ 347
METRIC RANK
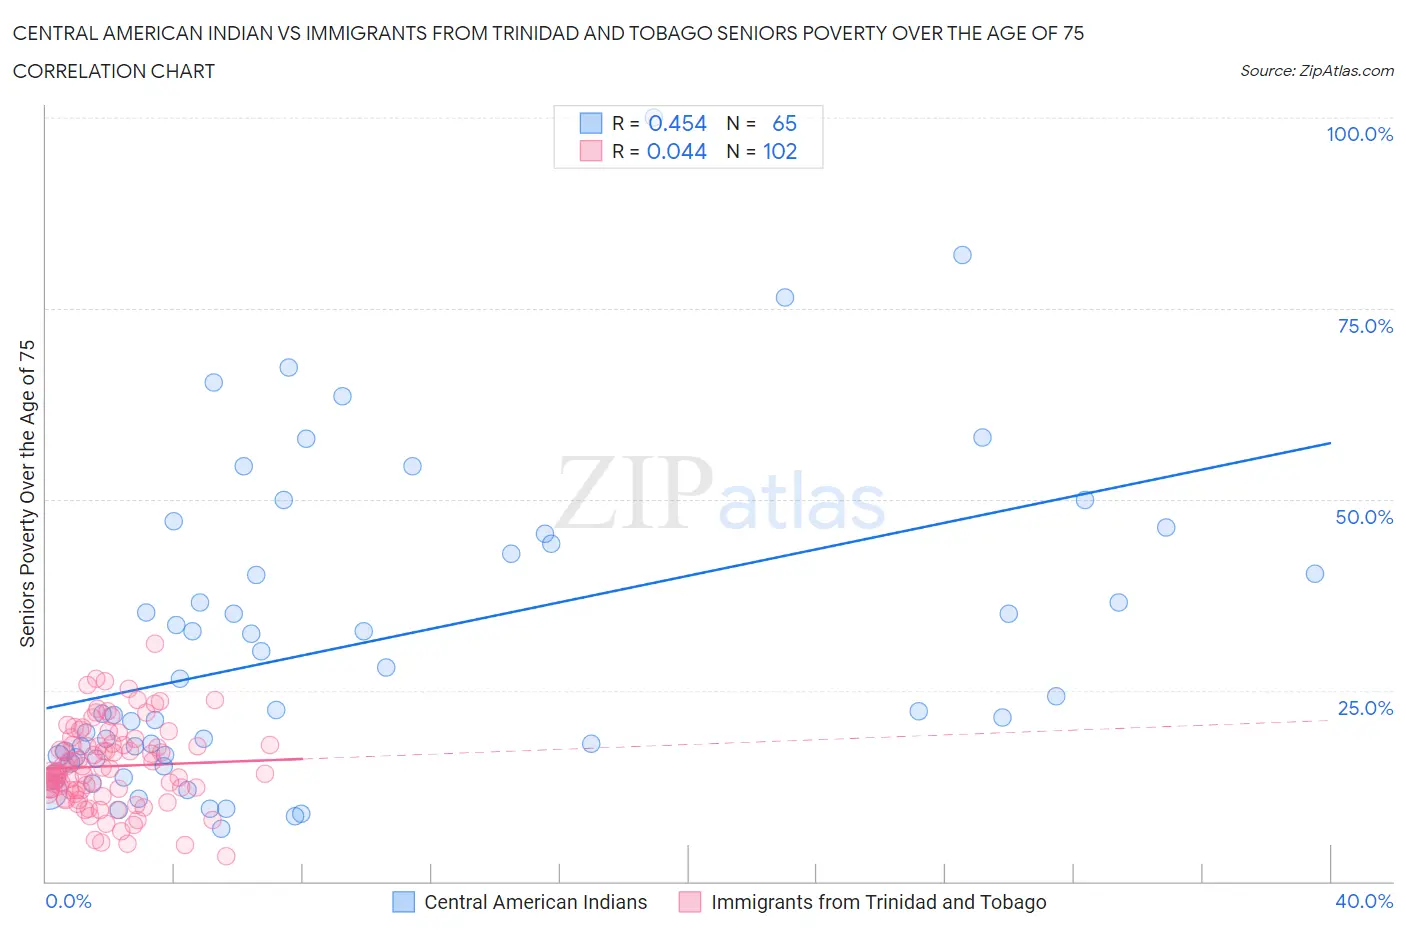
Central American Indian vs Immigrants from Trinidad and Tobago Seniors Poverty Over the Age of 75 Correlation Chart
The statistical analysis conducted on geographies consisting of 323,772,656 people shows a moderate positive correlation between the proportion of Central American Indians and poverty level among seniors over the age of 75 in the United States with a correlation coefficient (R) of 0.454 and weighted average of 16.5%. Similarly, the statistical analysis conducted on geographies consisting of 222,011,128 people shows no correlation between the proportion of Immigrants from Trinidad and Tobago and poverty level among seniors over the age of 75 in the United States with a correlation coefficient (R) of 0.044 and weighted average of 15.7%, a difference of 5.1%.
Seniors Poverty Over the Age of 75 Correlation Summary
| Measurement | Central American Indian | Immigrants from Trinidad and Tobago |
| Minimum | 6.9% | 3.2% |
| Maximum | 100.0% | 31.1% |
| Range | 93.1% | 27.9% |
| Mean | 31.1% | 15.1% |
| Median | 22.4% | 14.4% |
| Interquartile 25% (IQ1) | 16.4% | 11.9% |
| Interquartile 75% (IQ3) | 43.5% | 17.8% |
| Interquartile Range (IQR) | 27.1% | 5.9% |
| Standard Deviation (Sample) | 20.1% | 5.4% |
| Standard Deviation (Population) | 20.0% | 5.4% |
Demographics Similar to Central American Indians and Immigrants from Trinidad and Tobago by Seniors Poverty Over the Age of 75
In terms of seniors poverty over the age of 75, the demographic groups most similar to Central American Indians are Immigrants from Barbados (16.5%, a difference of 0.090%), Immigrants from Haiti (16.5%, a difference of 0.11%), Immigrants from Yemen (16.5%, a difference of 0.30%), Haitian (16.2%, a difference of 1.8%), and Houma (16.2%, a difference of 1.8%). Similarly, the demographic groups most similar to Immigrants from Trinidad and Tobago are Ecuadorian (15.7%, a difference of 0.040%), Immigrants from Honduras (15.7%, a difference of 0.18%), Hispanic or Latino (15.8%, a difference of 0.20%), Immigrants from West Indies (15.8%, a difference of 0.34%), and Immigrants from Bangladesh (15.8%, a difference of 0.38%).
| Demographics | Rating | Rank | Seniors Poverty Over the Age of 75 |
| Immigrants | Honduras | 0.0 /100 | #303 | Tragic 15.7% |
| Immigrants | Trinidad and Tobago | 0.0 /100 | #304 | Tragic 15.7% |
| Ecuadorians | 0.0 /100 | #305 | Tragic 15.7% |
| Hispanics or Latinos | 0.0 /100 | #306 | Tragic 15.8% |
| Immigrants | West Indies | 0.0 /100 | #307 | Tragic 15.8% |
| Immigrants | Bangladesh | 0.0 /100 | #308 | Tragic 15.8% |
| Yup'ik | 0.0 /100 | #309 | Tragic 15.8% |
| Vietnamese | 0.0 /100 | #310 | Tragic 15.9% |
| Trinidadians and Tobagonians | 0.0 /100 | #311 | Tragic 15.9% |
| Crow | 0.0 /100 | #312 | Tragic 15.9% |
| Barbadians | 0.0 /100 | #313 | Tragic 16.0% |
| Tsimshian | 0.0 /100 | #314 | Tragic 16.1% |
| Guyanese | 0.0 /100 | #315 | Tragic 16.1% |
| Immigrants | Ecuador | 0.0 /100 | #316 | Tragic 16.1% |
| Immigrants | Guyana | 0.0 /100 | #317 | Tragic 16.2% |
| Houma | 0.0 /100 | #318 | Tragic 16.2% |
| Haitians | 0.0 /100 | #319 | Tragic 16.2% |
| Immigrants | Yemen | 0.0 /100 | #320 | Tragic 16.5% |
| Immigrants | Haiti | 0.0 /100 | #321 | Tragic 16.5% |
| Immigrants | Barbados | 0.0 /100 | #322 | Tragic 16.5% |
| Central American Indians | 0.0 /100 | #323 | Tragic 16.5% |