Celtic vs West Indian Receiving Food Stamps
COMPARE
Celtic
West Indian
Receiving Food Stamps
Receiving Food Stamps Comparison
Celtics
West Indians
10.9%
RECEIVING FOOD STAMPS
87.8/ 100
METRIC RATING
140th/ 347
METRIC RANK
16.3%
RECEIVING FOOD STAMPS
0.0/ 100
METRIC RATING
304th/ 347
METRIC RANK
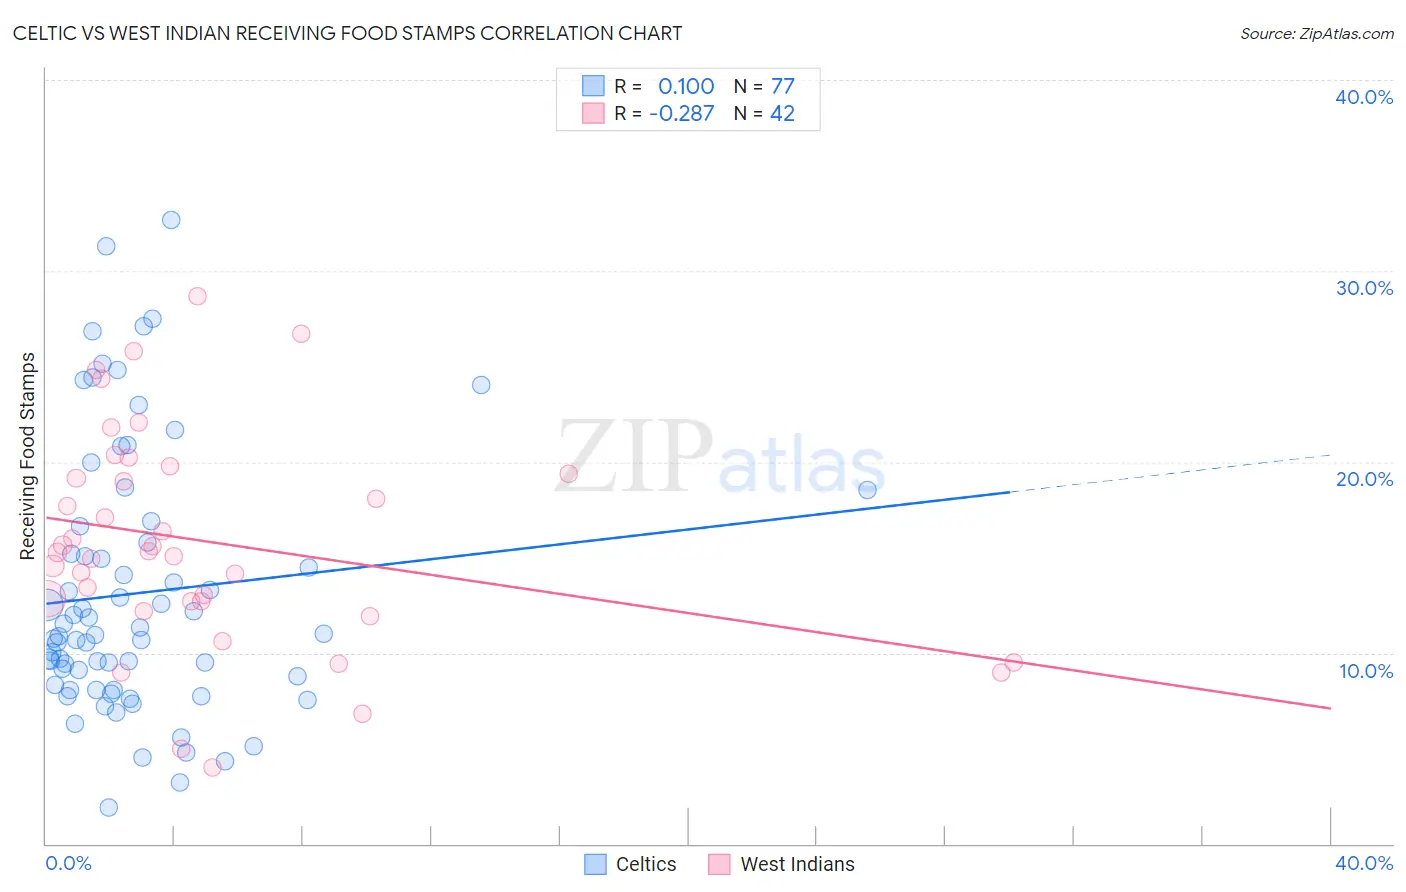
Celtic vs West Indian Receiving Food Stamps Correlation Chart
The statistical analysis conducted on geographies consisting of 168,687,125 people shows a slight positive correlation between the proportion of Celtics and percentage of population receiving government assistance and/or food stamps in the United States with a correlation coefficient (R) of 0.100 and weighted average of 10.9%. Similarly, the statistical analysis conducted on geographies consisting of 253,628,071 people shows a weak negative correlation between the proportion of West Indians and percentage of population receiving government assistance and/or food stamps in the United States with a correlation coefficient (R) of -0.287 and weighted average of 16.3%, a difference of 48.7%.
Receiving Food Stamps Correlation Summary
| Measurement | Celtic | West Indian |
| Minimum | 1.9% | 4.0% |
| Maximum | 32.7% | 28.7% |
| Range | 30.8% | 24.7% |
| Mean | 13.1% | 15.8% |
| Median | 11.0% | 15.3% |
| Interquartile 25% (IQ1) | 8.2% | 12.7% |
| Interquartile 75% (IQ3) | 16.2% | 19.4% |
| Interquartile Range (IQR) | 8.0% | 6.7% |
| Standard Deviation (Sample) | 6.9% | 5.7% |
| Standard Deviation (Population) | 6.8% | 5.6% |
Similar Demographics by Receiving Food Stamps
Demographics Similar to Celtics by Receiving Food Stamps
In terms of receiving food stamps, the demographic groups most similar to Celtics are Hmong (10.9%, a difference of 0.20%), Immigrants from Moldova (10.9%, a difference of 0.24%), Immigrants from Vietnam (11.0%, a difference of 0.36%), Chilean (11.0%, a difference of 0.53%), and Immigrants from Northern Africa (11.0%, a difference of 0.61%).
| Demographics | Rating | Rank | Receiving Food Stamps |
| Immigrants | Russia | 90.9 /100 | #133 | Exceptional 10.8% |
| Immigrants | Brazil | 90.3 /100 | #134 | Exceptional 10.8% |
| Argentineans | 90.2 /100 | #135 | Exceptional 10.8% |
| Slovaks | 89.8 /100 | #136 | Excellent 10.8% |
| Immigrants | Eastern Europe | 89.8 /100 | #137 | Excellent 10.8% |
| Immigrants | Moldova | 88.5 /100 | #138 | Excellent 10.9% |
| Hmong | 88.4 /100 | #139 | Excellent 10.9% |
| Celtics | 87.8 /100 | #140 | Excellent 10.9% |
| Immigrants | Vietnam | 86.7 /100 | #141 | Excellent 11.0% |
| Chileans | 86.2 /100 | #142 | Excellent 11.0% |
| Immigrants | Northern Africa | 86.0 /100 | #143 | Excellent 11.0% |
| Syrians | 85.5 /100 | #144 | Excellent 11.0% |
| Hungarians | 85.1 /100 | #145 | Excellent 11.0% |
| Taiwanese | 84.2 /100 | #146 | Excellent 11.0% |
| Whites/Caucasians | 83.9 /100 | #147 | Excellent 11.1% |
Demographics Similar to West Indians by Receiving Food Stamps
In terms of receiving food stamps, the demographic groups most similar to West Indians are Nicaraguan (16.1%, a difference of 0.68%), Immigrants from West Indies (16.1%, a difference of 0.77%), Immigrants from the Azores (16.4%, a difference of 0.88%), Jamaican (16.4%, a difference of 0.94%), and Houma (16.5%, a difference of 1.2%).
| Demographics | Rating | Rank | Receiving Food Stamps |
| Immigrants | Bahamas | 0.0 /100 | #297 | Tragic 15.8% |
| Immigrants | Trinidad and Tobago | 0.0 /100 | #298 | Tragic 15.8% |
| Hispanics or Latinos | 0.0 /100 | #299 | Tragic 15.8% |
| Immigrants | Bangladesh | 0.0 /100 | #300 | Tragic 15.9% |
| Trinidadians and Tobagonians | 0.0 /100 | #301 | Tragic 16.0% |
| Immigrants | West Indies | 0.0 /100 | #302 | Tragic 16.1% |
| Nicaraguans | 0.0 /100 | #303 | Tragic 16.1% |
| West Indians | 0.0 /100 | #304 | Tragic 16.3% |
| Immigrants | Azores | 0.0 /100 | #305 | Tragic 16.4% |
| Jamaicans | 0.0 /100 | #306 | Tragic 16.4% |
| Houma | 0.0 /100 | #307 | Tragic 16.5% |
| Barbadians | 0.0 /100 | #308 | Tragic 16.5% |
| U.S. Virgin Islanders | 0.0 /100 | #309 | Tragic 16.5% |
| Immigrants | Barbados | 0.0 /100 | #310 | Tragic 16.6% |
| Guyanese | 0.0 /100 | #311 | Tragic 16.7% |