Kiowa vs Immigrants Seniors Poverty Over the Age of 65
COMPARE
Kiowa
Immigrants
Seniors Poverty Over the Age of 65
Seniors Poverty Over the Age of 65 Comparison
Kiowa
Immigrants
12.8%
SENIORS POVERTY OVER THE AGE OF 65
0.0/ 100
METRIC RATING
273rd/ 347
METRIC RANK
12.4%
SENIORS POVERTY OVER THE AGE OF 65
0.2/ 100
METRIC RATING
257th/ 347
METRIC RANK
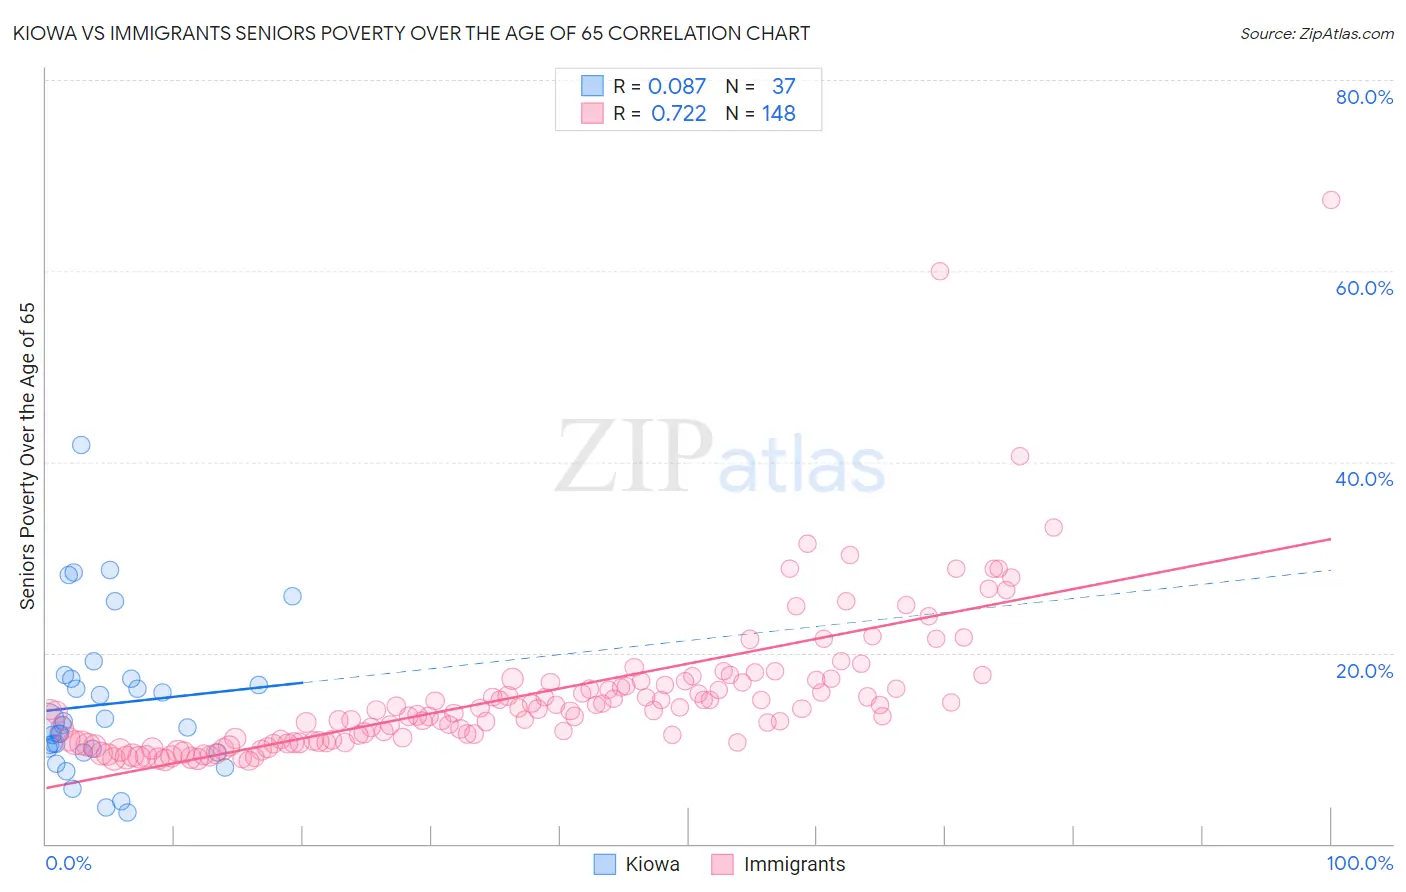
Kiowa vs Immigrants Seniors Poverty Over the Age of 65 Correlation Chart
The statistical analysis conducted on geographies consisting of 56,060,664 people shows a slight positive correlation between the proportion of Kiowa and poverty level among seniors over the age of 65 in the United States with a correlation coefficient (R) of 0.087 and weighted average of 12.8%. Similarly, the statistical analysis conducted on geographies consisting of 571,862,894 people shows a strong positive correlation between the proportion of Immigrants and poverty level among seniors over the age of 65 in the United States with a correlation coefficient (R) of 0.722 and weighted average of 12.4%, a difference of 3.0%.
Seniors Poverty Over the Age of 65 Correlation Summary
| Measurement | Kiowa | Immigrants |
| Minimum | 3.3% | 8.7% |
| Maximum | 41.7% | 67.5% |
| Range | 38.4% | 58.8% |
| Mean | 14.6% | 15.6% |
| Median | 12.4% | 14.0% |
| Interquartile 25% (IQ1) | 9.7% | 10.7% |
| Interquartile 75% (IQ3) | 17.2% | 16.9% |
| Interquartile Range (IQR) | 7.5% | 6.2% |
| Standard Deviation (Sample) | 8.1% | 8.0% |
| Standard Deviation (Population) | 8.0% | 8.0% |
Demographics Similar to Kiowa and Immigrants by Seniors Poverty Over the Age of 65
In terms of seniors poverty over the age of 65, the demographic groups most similar to Kiowa are Immigrants from Uruguay (12.8%, a difference of 0.12%), Immigrants from Ghana (12.8%, a difference of 0.15%), Salvadoran (12.8%, a difference of 0.25%), Immigrants from South America (12.7%, a difference of 0.42%), and Immigrants from Venezuela (12.7%, a difference of 0.67%). Similarly, the demographic groups most similar to Immigrants are Immigrants from Panama (12.4%, a difference of 0.010%), Mexican American Indian (12.4%, a difference of 0.24%), Dutch West Indian (12.4%, a difference of 0.25%), Ghanaian (12.4%, a difference of 0.28%), and South American (12.5%, a difference of 0.51%).
| Demographics | Rating | Rank | Seniors Poverty Over the Age of 65 |
| Mexican American Indians | 0.3 /100 | #255 | Tragic 12.4% |
| Immigrants | Panama | 0.2 /100 | #256 | Tragic 12.4% |
| Immigrants | Immigrants | 0.2 /100 | #257 | Tragic 12.4% |
| Dutch West Indians | 0.2 /100 | #258 | Tragic 12.4% |
| Ghanaians | 0.2 /100 | #259 | Tragic 12.4% |
| South Americans | 0.2 /100 | #260 | Tragic 12.5% |
| Colombians | 0.2 /100 | #261 | Tragic 12.5% |
| Venezuelans | 0.1 /100 | #262 | Tragic 12.5% |
| Soviet Union | 0.1 /100 | #263 | Tragic 12.6% |
| Inupiat | 0.1 /100 | #264 | Tragic 12.6% |
| Immigrants | Western Africa | 0.1 /100 | #265 | Tragic 12.6% |
| Africans | 0.1 /100 | #266 | Tragic 12.6% |
| Blackfeet | 0.1 /100 | #267 | Tragic 12.6% |
| Immigrants | Somalia | 0.1 /100 | #268 | Tragic 12.6% |
| Immigrants | Venezuela | 0.1 /100 | #269 | Tragic 12.7% |
| Immigrants | South America | 0.1 /100 | #270 | Tragic 12.7% |
| Immigrants | Ghana | 0.1 /100 | #271 | Tragic 12.8% |
| Immigrants | Uruguay | 0.1 /100 | #272 | Tragic 12.8% |
| Kiowa | 0.0 /100 | #273 | Tragic 12.8% |
| Salvadorans | 0.0 /100 | #274 | Tragic 12.8% |
| Immigrants | Colombia | 0.0 /100 | #275 | Tragic 12.9% |