Carpatho Rusyn vs South American Child Poverty Among Boys Under 16
COMPARE
Carpatho Rusyn
South American
Child Poverty Among Boys Under 16
Child Poverty Among Boys Under 16 Comparison
Carpatho Rusyns
South Americans
15.4%
CHILD POVERTY AMONG BOYS UNDER 16
91.1/ 100
METRIC RATING
127th/ 347
METRIC RANK
16.3%
CHILD POVERTY AMONG BOYS UNDER 16
55.3/ 100
METRIC RATING
168th/ 347
METRIC RANK
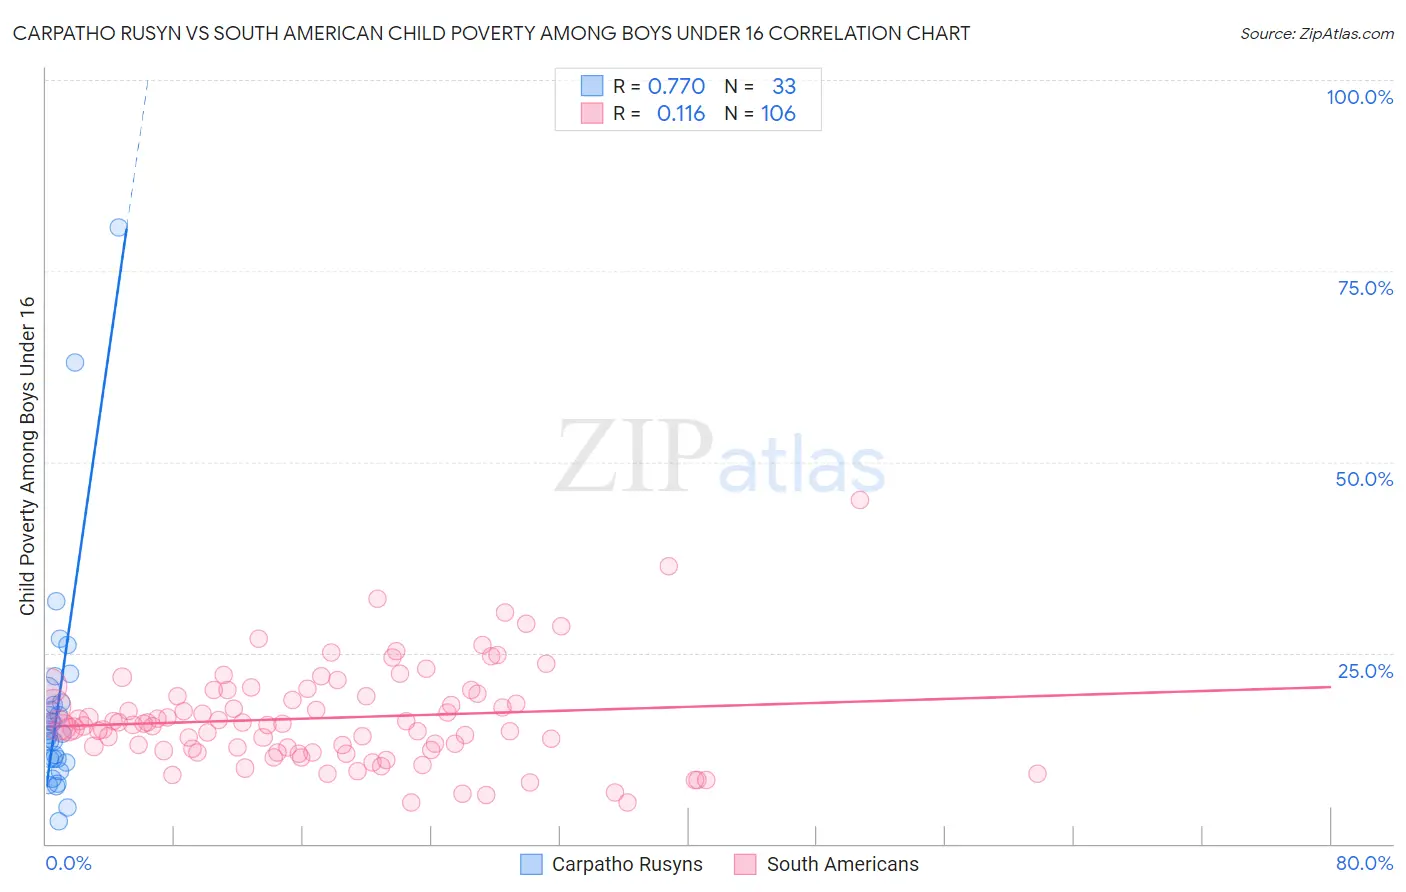
Carpatho Rusyn vs South American Child Poverty Among Boys Under 16 Correlation Chart
The statistical analysis conducted on geographies consisting of 58,506,297 people shows a strong positive correlation between the proportion of Carpatho Rusyns and poverty level among boys under the age of 16 in the United States with a correlation coefficient (R) of 0.770 and weighted average of 15.4%. Similarly, the statistical analysis conducted on geographies consisting of 482,291,014 people shows a poor positive correlation between the proportion of South Americans and poverty level among boys under the age of 16 in the United States with a correlation coefficient (R) of 0.116 and weighted average of 16.3%, a difference of 6.3%.
Child Poverty Among Boys Under 16 Correlation Summary
| Measurement | Carpatho Rusyn | South American |
| Minimum | 3.0% | 5.4% |
| Maximum | 80.8% | 45.1% |
| Range | 77.8% | 39.7% |
| Mean | 18.2% | 16.5% |
| Median | 14.5% | 15.5% |
| Interquartile 25% (IQ1) | 10.9% | 12.3% |
| Interquartile 75% (IQ3) | 19.3% | 19.7% |
| Interquartile Range (IQR) | 8.4% | 7.4% |
| Standard Deviation (Sample) | 15.4% | 6.5% |
| Standard Deviation (Population) | 15.1% | 6.5% |
Similar Demographics by Child Poverty Among Boys Under 16
Demographics Similar to Carpatho Rusyns by Child Poverty Among Boys Under 16
In terms of child poverty among boys under 16, the demographic groups most similar to Carpatho Rusyns are Palestinian (15.4%, a difference of 0.050%), Canadian (15.4%, a difference of 0.19%), Immigrants from Brazil (15.4%, a difference of 0.31%), Mongolian (15.4%, a difference of 0.33%), and Czechoslovakian (15.3%, a difference of 0.36%).
| Demographics | Rating | Rank | Child Poverty Among Boys Under 16 |
| South Africans | 93.0 /100 | #120 | Exceptional 15.2% |
| Scottish | 93.0 /100 | #121 | Exceptional 15.2% |
| Immigrants | Malaysia | 92.8 /100 | #122 | Exceptional 15.3% |
| Immigrants | Norway | 92.3 /100 | #123 | Exceptional 15.3% |
| Tlingit-Haida | 92.2 /100 | #124 | Exceptional 15.3% |
| Czechoslovakians | 92.1 /100 | #125 | Exceptional 15.3% |
| Palestinians | 91.3 /100 | #126 | Exceptional 15.4% |
| Carpatho Rusyns | 91.1 /100 | #127 | Exceptional 15.4% |
| Canadians | 90.6 /100 | #128 | Exceptional 15.4% |
| Immigrants | Brazil | 90.3 /100 | #129 | Exceptional 15.4% |
| Mongolians | 90.2 /100 | #130 | Exceptional 15.4% |
| Immigrants | Western Europe | 90.0 /100 | #131 | Exceptional 15.4% |
| Immigrants | Kazakhstan | 88.7 /100 | #132 | Excellent 15.5% |
| Welsh | 88.3 /100 | #133 | Excellent 15.5% |
| Peruvians | 88.1 /100 | #134 | Excellent 15.5% |
Demographics Similar to South Americans by Child Poverty Among Boys Under 16
In terms of child poverty among boys under 16, the demographic groups most similar to South Americans are Afghan (16.3%, a difference of 0.010%), Immigrants from Saudi Arabia (16.4%, a difference of 0.19%), Immigrants from Bosnia and Herzegovina (16.4%, a difference of 0.40%), Immigrants from Ethiopia (16.4%, a difference of 0.45%), and Immigrants from Colombia (16.4%, a difference of 0.51%).
| Demographics | Rating | Rank | Child Poverty Among Boys Under 16 |
| Immigrants | Oceania | 71.3 /100 | #161 | Good 16.0% |
| Guamanians/Chamorros | 69.6 /100 | #162 | Good 16.1% |
| Costa Ricans | 68.1 /100 | #163 | Good 16.1% |
| Immigrants | Albania | 67.9 /100 | #164 | Good 16.1% |
| Colombians | 65.2 /100 | #165 | Good 16.1% |
| Immigrants | Germany | 63.6 /100 | #166 | Good 16.2% |
| Afghans | 55.4 /100 | #167 | Average 16.3% |
| South Americans | 55.3 /100 | #168 | Average 16.3% |
| Immigrants | Saudi Arabia | 53.6 /100 | #169 | Average 16.4% |
| Immigrants | Bosnia and Herzegovina | 51.7 /100 | #170 | Average 16.4% |
| Immigrants | Ethiopia | 51.3 /100 | #171 | Average 16.4% |
| Immigrants | Colombia | 50.8 /100 | #172 | Average 16.4% |
| Tsimshian | 50.5 /100 | #173 | Average 16.4% |
| Uruguayans | 50.0 /100 | #174 | Average 16.4% |
| Immigrants | Syria | 49.0 /100 | #175 | Average 16.5% |