Immigrants from Eastern Asia vs Immigrants from Ethiopia Receiving Food Stamps
COMPARE
Immigrants from Eastern Asia
Immigrants from Ethiopia
Receiving Food Stamps
Receiving Food Stamps Comparison
Immigrants from Eastern Asia
Immigrants from Ethiopia
9.3%
RECEIVING FOOD STAMPS
99.7/ 100
METRIC RATING
31st/ 347
METRIC RANK
10.7%
RECEIVING FOOD STAMPS
92.6/ 100
METRIC RATING
127th/ 347
METRIC RANK
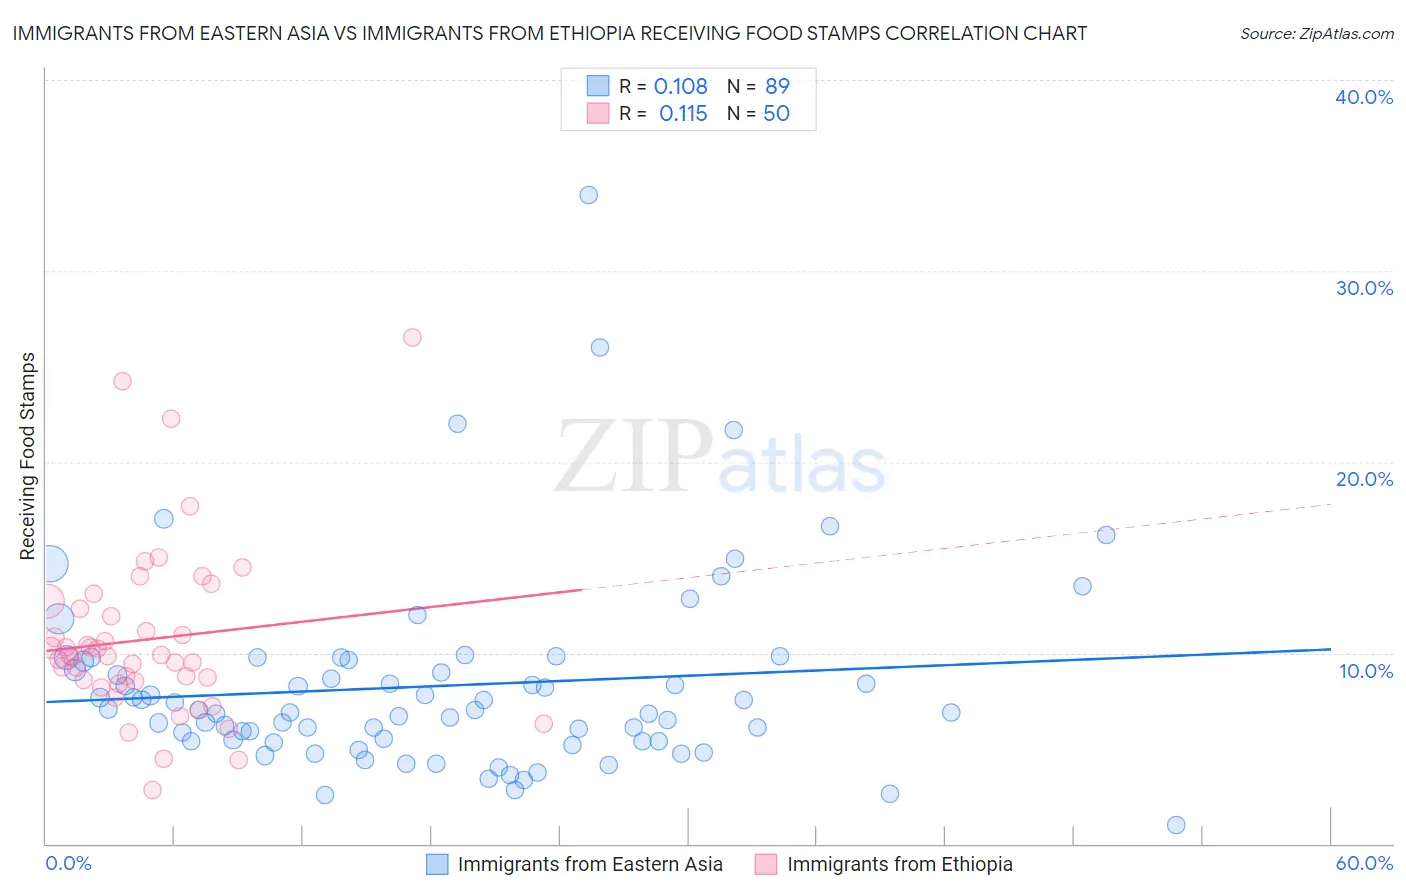
Immigrants from Eastern Asia vs Immigrants from Ethiopia Receiving Food Stamps Correlation Chart
The statistical analysis conducted on geographies consisting of 497,431,839 people shows a poor positive correlation between the proportion of Immigrants from Eastern Asia and percentage of population receiving government assistance and/or food stamps in the United States with a correlation coefficient (R) of 0.108 and weighted average of 9.3%. Similarly, the statistical analysis conducted on geographies consisting of 211,250,124 people shows a poor positive correlation between the proportion of Immigrants from Ethiopia and percentage of population receiving government assistance and/or food stamps in the United States with a correlation coefficient (R) of 0.115 and weighted average of 10.7%, a difference of 14.9%.
Receiving Food Stamps Correlation Summary
| Measurement | Immigrants from Eastern Asia | Immigrants from Ethiopia |
| Minimum | 1.0% | 2.8% |
| Maximum | 34.0% | 26.5% |
| Range | 33.0% | 23.7% |
| Mean | 8.3% | 10.7% |
| Median | 7.0% | 9.8% |
| Interquartile 25% (IQ1) | 5.4% | 8.5% |
| Interquartile 75% (IQ3) | 9.6% | 12.3% |
| Interquartile Range (IQR) | 4.2% | 3.8% |
| Standard Deviation (Sample) | 5.1% | 4.5% |
| Standard Deviation (Population) | 5.1% | 4.5% |
Similar Demographics by Receiving Food Stamps
Demographics Similar to Immigrants from Eastern Asia by Receiving Food Stamps
In terms of receiving food stamps, the demographic groups most similar to Immigrants from Eastern Asia are Bolivian (9.3%, a difference of 0.31%), Immigrants from Sweden (9.3%, a difference of 0.41%), Immigrants from Lithuania (9.2%, a difference of 0.78%), Czech (9.2%, a difference of 1.1%), and Bhutanese (9.2%, a difference of 1.1%).
| Demographics | Rating | Rank | Receiving Food Stamps |
| Immigrants | Northern Europe | 99.8 /100 | #24 | Exceptional 9.2% |
| Immigrants | Ireland | 99.8 /100 | #25 | Exceptional 9.2% |
| Swedes | 99.8 /100 | #26 | Exceptional 9.2% |
| Bhutanese | 99.8 /100 | #27 | Exceptional 9.2% |
| Czechs | 99.8 /100 | #28 | Exceptional 9.2% |
| Immigrants | Lithuania | 99.8 /100 | #29 | Exceptional 9.2% |
| Immigrants | Sweden | 99.7 /100 | #30 | Exceptional 9.3% |
| Immigrants | Eastern Asia | 99.7 /100 | #31 | Exceptional 9.3% |
| Bolivians | 99.7 /100 | #32 | Exceptional 9.3% |
| Zimbabweans | 99.6 /100 | #33 | Exceptional 9.5% |
| Turks | 99.6 /100 | #34 | Exceptional 9.5% |
| Immigrants | Austria | 99.6 /100 | #35 | Exceptional 9.5% |
| Estonians | 99.6 /100 | #36 | Exceptional 9.5% |
| Europeans | 99.6 /100 | #37 | Exceptional 9.5% |
| Immigrants | Sri Lanka | 99.5 /100 | #38 | Exceptional 9.5% |
Demographics Similar to Immigrants from Ethiopia by Receiving Food Stamps
In terms of receiving food stamps, the demographic groups most similar to Immigrants from Ethiopia are Immigrants from Jordan (10.7%, a difference of 0.010%), Yugoslavian (10.7%, a difference of 0.010%), Afghan (10.7%, a difference of 0.020%), Israeli (10.7%, a difference of 0.11%), and French (10.7%, a difference of 0.11%).
| Demographics | Rating | Rank | Receiving Food Stamps |
| Ethiopians | 93.9 /100 | #120 | Exceptional 10.6% |
| Slavs | 93.8 /100 | #121 | Exceptional 10.6% |
| Sri Lankans | 93.7 /100 | #122 | Exceptional 10.6% |
| Immigrants | Philippines | 93.3 /100 | #123 | Exceptional 10.7% |
| Paraguayans | 93.0 /100 | #124 | Exceptional 10.7% |
| Ukrainians | 92.8 /100 | #125 | Exceptional 10.7% |
| Afghans | 92.6 /100 | #126 | Exceptional 10.7% |
| Immigrants | Ethiopia | 92.6 /100 | #127 | Exceptional 10.7% |
| Immigrants | Jordan | 92.5 /100 | #128 | Exceptional 10.7% |
| Yugoslavians | 92.5 /100 | #129 | Exceptional 10.7% |
| Israelis | 92.4 /100 | #130 | Exceptional 10.7% |
| French | 92.3 /100 | #131 | Exceptional 10.7% |
| Immigrants | Germany | 92.0 /100 | #132 | Exceptional 10.7% |
| Immigrants | Russia | 90.9 /100 | #133 | Exceptional 10.8% |
| Immigrants | Brazil | 90.3 /100 | #134 | Exceptional 10.8% |