Carpatho Rusyn vs Immigrants from Bosnia and Herzegovina 3rd Grade
COMPARE
Carpatho Rusyn
Immigrants from Bosnia and Herzegovina
3rd Grade
3rd Grade Comparison
Carpatho Rusyns
Immigrants from Bosnia and Herzegovina
98.5%
3RD GRADE
100.0/ 100
METRIC RATING
14th/ 347
METRIC RANK
97.8%
3RD GRADE
56.2/ 100
METRIC RATING
164th/ 347
METRIC RANK
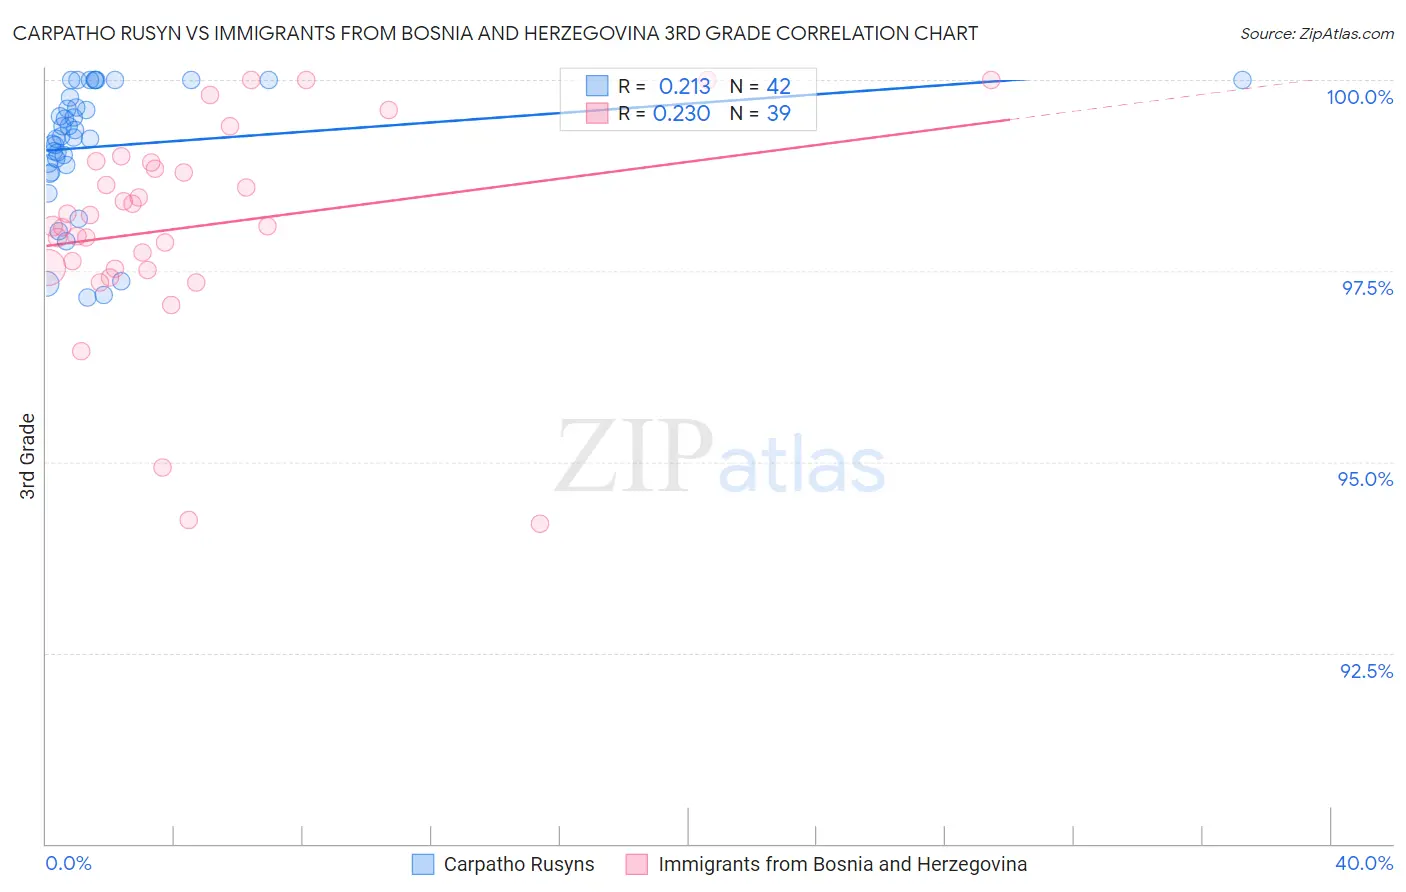
Carpatho Rusyn vs Immigrants from Bosnia and Herzegovina 3rd Grade Correlation Chart
The statistical analysis conducted on geographies consisting of 58,871,690 people shows a weak positive correlation between the proportion of Carpatho Rusyns and percentage of population with at least 3rd grade education in the United States with a correlation coefficient (R) of 0.213 and weighted average of 98.5%. Similarly, the statistical analysis conducted on geographies consisting of 156,779,463 people shows a weak positive correlation between the proportion of Immigrants from Bosnia and Herzegovina and percentage of population with at least 3rd grade education in the United States with a correlation coefficient (R) of 0.230 and weighted average of 97.8%, a difference of 0.78%.
3rd Grade Correlation Summary
| Measurement | Carpatho Rusyn | Immigrants from Bosnia and Herzegovina |
| Minimum | 97.2% | 94.2% |
| Maximum | 100.0% | 100.0% |
| Range | 2.8% | 5.8% |
| Mean | 99.1% | 98.1% |
| Median | 99.3% | 98.1% |
| Interquartile 25% (IQ1) | 98.9% | 97.5% |
| Interquartile 75% (IQ3) | 99.8% | 98.9% |
| Interquartile Range (IQR) | 0.88% | 1.4% |
| Standard Deviation (Sample) | 0.82% | 1.4% |
| Standard Deviation (Population) | 0.81% | 1.4% |
Similar Demographics by 3rd Grade
Demographics Similar to Carpatho Rusyns by 3rd Grade
In terms of 3rd grade, the demographic groups most similar to Carpatho Rusyns are English (98.6%, a difference of 0.0%), Tlingit-Haida (98.5%, a difference of 0.0%), Swedish (98.5%, a difference of 0.010%), Slovene (98.6%, a difference of 0.020%), and Alaska Native (98.6%, a difference of 0.030%).
| Demographics | Rating | Rank | 3rd Grade |
| Norwegians | 100.0 /100 | #7 | Exceptional 98.6% |
| Slovaks | 100.0 /100 | #8 | Exceptional 98.6% |
| Germans | 100.0 /100 | #9 | Exceptional 98.6% |
| Alaska Natives | 100.0 /100 | #10 | Exceptional 98.6% |
| Slovenes | 100.0 /100 | #11 | Exceptional 98.6% |
| English | 100.0 /100 | #12 | Exceptional 98.6% |
| Tlingit-Haida | 100.0 /100 | #13 | Exceptional 98.5% |
| Carpatho Rusyns | 100.0 /100 | #14 | Exceptional 98.5% |
| Swedes | 100.0 /100 | #15 | Exceptional 98.5% |
| Scottish | 100.0 /100 | #16 | Exceptional 98.5% |
| Dutch | 100.0 /100 | #17 | Exceptional 98.5% |
| Irish | 100.0 /100 | #18 | Exceptional 98.5% |
| Poles | 100.0 /100 | #19 | Exceptional 98.5% |
| Pennsylvania Germans | 100.0 /100 | #20 | Exceptional 98.5% |
| Lithuanians | 100.0 /100 | #21 | Exceptional 98.5% |
Demographics Similar to Immigrants from Bosnia and Herzegovina by 3rd Grade
In terms of 3rd grade, the demographic groups most similar to Immigrants from Bosnia and Herzegovina are Marshallese (97.8%, a difference of 0.0%), Ugandan (97.8%, a difference of 0.0%), Dutch West Indian (97.8%, a difference of 0.0%), Chilean (97.8%, a difference of 0.0%), and French American Indian (97.8%, a difference of 0.010%).
| Demographics | Rating | Rank | 3rd Grade |
| Immigrants | Italy | 61.2 /100 | #157 | Good 97.8% |
| Venezuelans | 60.9 /100 | #158 | Good 97.8% |
| French American Indians | 60.0 /100 | #159 | Average 97.8% |
| Immigrants | Iran | 59.1 /100 | #160 | Average 97.8% |
| Albanians | 58.8 /100 | #161 | Average 97.8% |
| Immigrants | Jordan | 57.9 /100 | #162 | Average 97.8% |
| Marshallese | 57.2 /100 | #163 | Average 97.8% |
| Immigrants | Bosnia and Herzegovina | 56.2 /100 | #164 | Average 97.8% |
| Ugandans | 56.1 /100 | #165 | Average 97.8% |
| Dutch West Indians | 55.5 /100 | #166 | Average 97.8% |
| Chileans | 55.3 /100 | #167 | Average 97.8% |
| Immigrants | Spain | 54.3 /100 | #168 | Average 97.8% |
| Comanche | 53.8 /100 | #169 | Average 97.8% |
| Brazilians | 53.7 /100 | #170 | Average 97.8% |
| Kenyans | 51.8 /100 | #171 | Average 97.8% |