Carpatho Rusyn vs Spanish American Indian Female Poverty Among 18-24 Year Olds
COMPARE
Carpatho Rusyn
Spanish American Indian
Female Poverty Among 18-24 Year Olds
Female Poverty Among 18-24 Year Olds Comparison
Carpatho Rusyns
Spanish American Indians
21.0%
FEMALE POVERTY AMONG 18-24 YEAR OLDS
2.5/ 100
METRIC RATING
249th/ 347
METRIC RANK
18.1%
FEMALE POVERTY AMONG 18-24 YEAR OLDS
100.0/ 100
METRIC RATING
45th/ 347
METRIC RANK
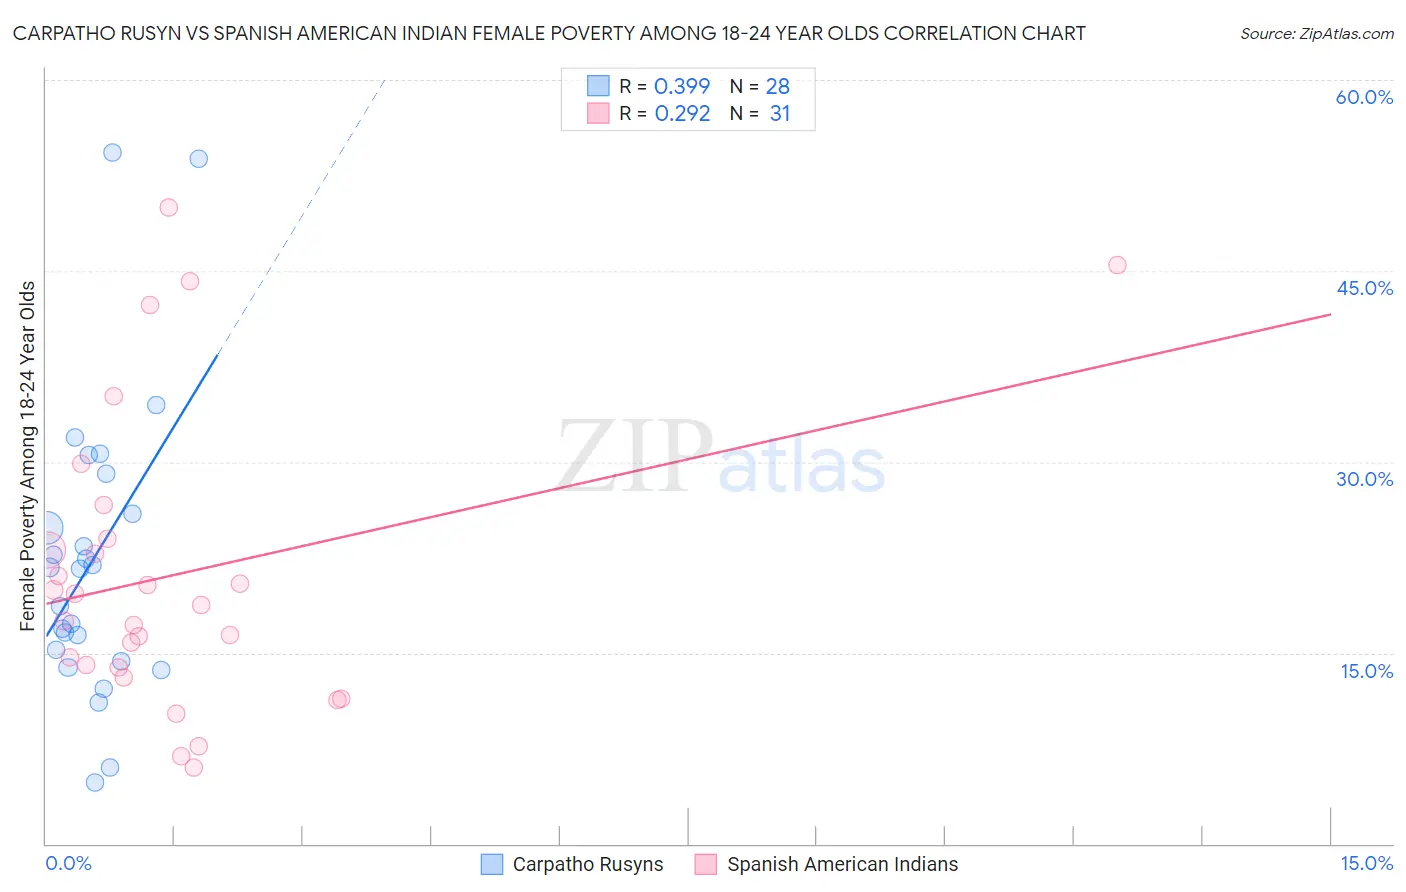
Carpatho Rusyn vs Spanish American Indian Female Poverty Among 18-24 Year Olds Correlation Chart
The statistical analysis conducted on geographies consisting of 58,245,261 people shows a mild positive correlation between the proportion of Carpatho Rusyns and poverty level among females between the ages 18 and 24 in the United States with a correlation coefficient (R) of 0.399 and weighted average of 21.0%. Similarly, the statistical analysis conducted on geographies consisting of 73,008,274 people shows a weak positive correlation between the proportion of Spanish American Indians and poverty level among females between the ages 18 and 24 in the United States with a correlation coefficient (R) of 0.292 and weighted average of 18.1%, a difference of 16.0%.
Female Poverty Among 18-24 Year Olds Correlation Summary
| Measurement | Carpatho Rusyn | Spanish American Indian |
| Minimum | 4.8% | 6.0% |
| Maximum | 54.3% | 50.0% |
| Range | 49.4% | 44.0% |
| Mean | 22.4% | 21.2% |
| Median | 21.6% | 18.8% |
| Interquartile 25% (IQ1) | 14.8% | 13.8% |
| Interquartile 75% (IQ3) | 27.5% | 24.0% |
| Interquartile Range (IQR) | 12.7% | 10.1% |
| Standard Deviation (Sample) | 11.6% | 11.5% |
| Standard Deviation (Population) | 11.4% | 11.3% |
Similar Demographics by Female Poverty Among 18-24 Year Olds
Demographics Similar to Carpatho Rusyns by Female Poverty Among 18-24 Year Olds
In terms of female poverty among 18-24 year olds, the demographic groups most similar to Carpatho Rusyns are Immigrants from Kenya (21.0%, a difference of 0.020%), Immigrants from West Indies (21.0%, a difference of 0.13%), Immigrants from Africa (21.0%, a difference of 0.22%), Immigrants from Australia (20.9%, a difference of 0.27%), and West Indian (21.1%, a difference of 0.33%).
| Demographics | Rating | Rank | Female Poverty Among 18-24 Year Olds |
| Israelis | 4.1 /100 | #242 | Tragic 20.9% |
| Marshallese | 3.4 /100 | #243 | Tragic 20.9% |
| Immigrants | Thailand | 3.4 /100 | #244 | Tragic 20.9% |
| Aleuts | 3.3 /100 | #245 | Tragic 20.9% |
| Immigrants | Australia | 3.1 /100 | #246 | Tragic 20.9% |
| Immigrants | Africa | 3.0 /100 | #247 | Tragic 21.0% |
| Immigrants | Kenya | 2.5 /100 | #248 | Tragic 21.0% |
| Carpatho Rusyns | 2.5 /100 | #249 | Tragic 21.0% |
| Immigrants | West Indies | 2.2 /100 | #250 | Tragic 21.0% |
| West Indians | 1.9 /100 | #251 | Tragic 21.1% |
| South Africans | 1.6 /100 | #252 | Tragic 21.1% |
| Delaware | 1.6 /100 | #253 | Tragic 21.1% |
| British West Indians | 1.2 /100 | #254 | Tragic 21.2% |
| Immigrants | Grenada | 1.2 /100 | #255 | Tragic 21.2% |
| Tsimshian | 1.0 /100 | #256 | Tragic 21.2% |
Demographics Similar to Spanish American Indians by Female Poverty Among 18-24 Year Olds
In terms of female poverty among 18-24 year olds, the demographic groups most similar to Spanish American Indians are Nicaraguan (18.1%, a difference of 0.090%), Macedonian (18.1%, a difference of 0.17%), Bulgarian (18.1%, a difference of 0.18%), Immigrants from Southern Europe (18.2%, a difference of 0.28%), and Asian (18.2%, a difference of 0.37%).
| Demographics | Rating | Rank | Female Poverty Among 18-24 Year Olds |
| South Americans | 100.0 /100 | #38 | Exceptional 18.0% |
| Puget Sound Salish | 100.0 /100 | #39 | Exceptional 18.0% |
| Immigrants | Romania | 100.0 /100 | #40 | Exceptional 18.0% |
| Immigrants | Argentina | 100.0 /100 | #41 | Exceptional 18.0% |
| Bulgarians | 100.0 /100 | #42 | Exceptional 18.1% |
| Macedonians | 100.0 /100 | #43 | Exceptional 18.1% |
| Nicaraguans | 100.0 /100 | #44 | Exceptional 18.1% |
| Spanish American Indians | 100.0 /100 | #45 | Exceptional 18.1% |
| Immigrants | Southern Europe | 100.0 /100 | #46 | Exceptional 18.2% |
| Asians | 100.0 /100 | #47 | Exceptional 18.2% |
| Sri Lankans | 100.0 /100 | #48 | Exceptional 18.2% |
| Bhutanese | 100.0 /100 | #49 | Exceptional 18.2% |
| Samoans | 100.0 /100 | #50 | Exceptional 18.2% |
| Immigrants | Eastern Europe | 99.9 /100 | #51 | Exceptional 18.2% |
| Immigrants | Ireland | 99.9 /100 | #52 | Exceptional 18.3% |