Taiwanese vs Indonesian Family Poverty
COMPARE
Taiwanese
Indonesian
Family Poverty
Family Poverty Comparison
Taiwanese
Indonesians
8.2%
FAMILY POVERTY
94.6/ 100
METRIC RATING
111th/ 347
METRIC RANK
11.3%
FAMILY POVERTY
0.0/ 100
METRIC RATING
283rd/ 347
METRIC RANK
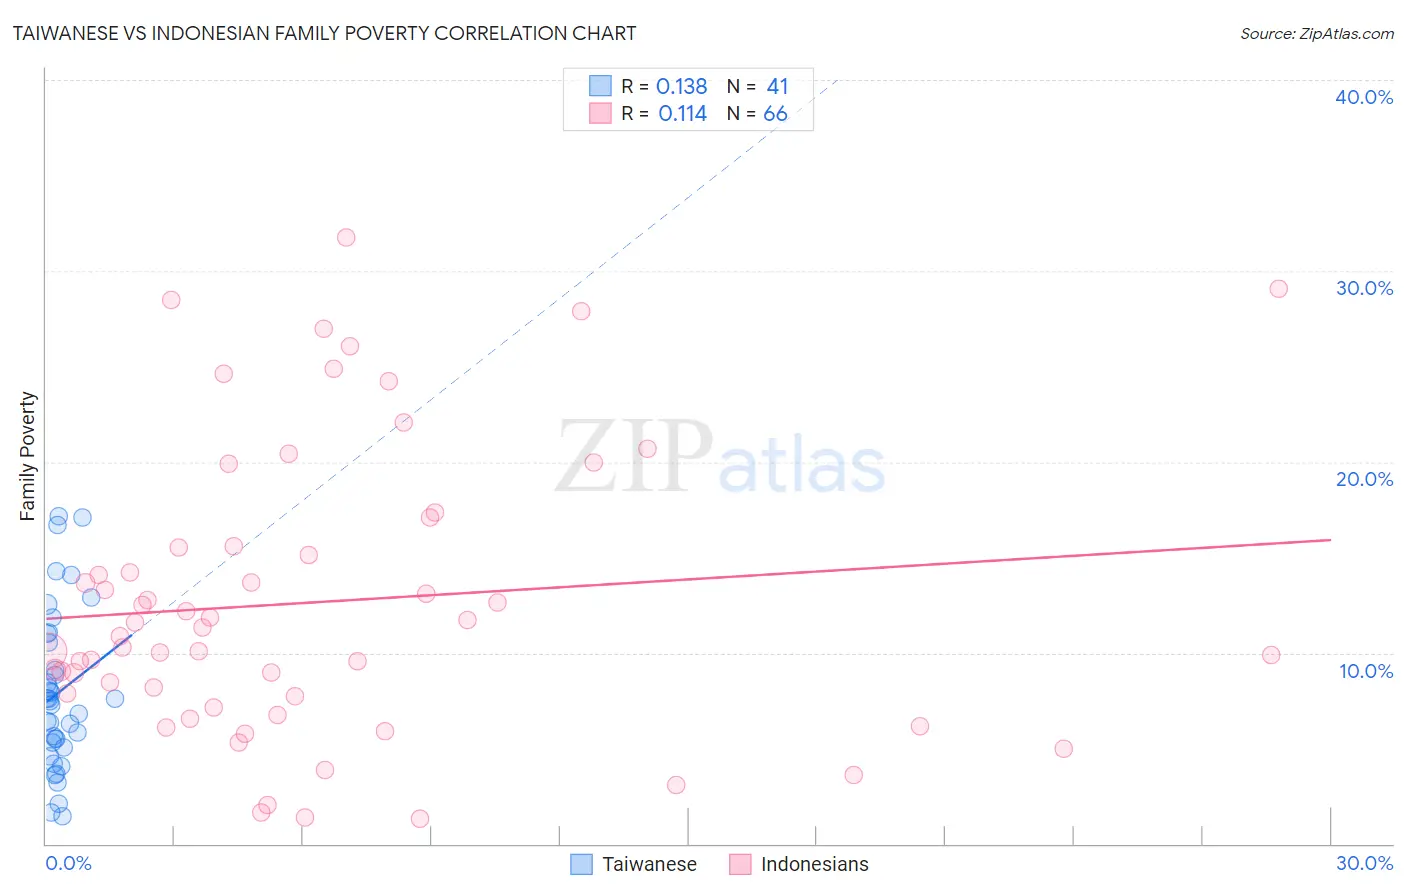
Taiwanese vs Indonesian Family Poverty Correlation Chart
The statistical analysis conducted on geographies consisting of 31,669,641 people shows a poor positive correlation between the proportion of Taiwanese and poverty level among families in the United States with a correlation coefficient (R) of 0.138 and weighted average of 8.2%. Similarly, the statistical analysis conducted on geographies consisting of 162,562,549 people shows a poor positive correlation between the proportion of Indonesians and poverty level among families in the United States with a correlation coefficient (R) of 0.114 and weighted average of 11.3%, a difference of 38.7%.
Family Poverty Correlation Summary
| Measurement | Taiwanese | Indonesian |
| Minimum | 1.5% | 1.3% |
| Maximum | 17.2% | 31.7% |
| Range | 15.7% | 30.4% |
| Mean | 7.9% | 12.7% |
| Median | 7.4% | 11.1% |
| Interquartile 25% (IQ1) | 5.2% | 7.7% |
| Interquartile 75% (IQ3) | 10.8% | 15.6% |
| Interquartile Range (IQR) | 5.6% | 7.9% |
| Standard Deviation (Sample) | 4.1% | 7.5% |
| Standard Deviation (Population) | 4.1% | 7.5% |
Similar Demographics by Family Poverty
Demographics Similar to Taiwanese by Family Poverty
In terms of family poverty, the demographic groups most similar to Taiwanese are Romanian (8.2%, a difference of 0.060%), Immigrants from France (8.2%, a difference of 0.11%), Jordanian (8.2%, a difference of 0.15%), Basque (8.1%, a difference of 0.23%), and Canadian (8.2%, a difference of 0.28%).
| Demographics | Rating | Rank | Family Poverty |
| Slavs | 95.6 /100 | #104 | Exceptional 8.1% |
| Laotians | 95.6 /100 | #105 | Exceptional 8.1% |
| Egyptians | 95.1 /100 | #106 | Exceptional 8.1% |
| French Canadians | 95.0 /100 | #107 | Exceptional 8.1% |
| Basques | 94.9 /100 | #108 | Exceptional 8.1% |
| Jordanians | 94.8 /100 | #109 | Exceptional 8.2% |
| Romanians | 94.7 /100 | #110 | Exceptional 8.2% |
| Taiwanese | 94.6 /100 | #111 | Exceptional 8.2% |
| Immigrants | France | 94.4 /100 | #112 | Exceptional 8.2% |
| Canadians | 94.2 /100 | #113 | Exceptional 8.2% |
| Immigrants | Zimbabwe | 94.0 /100 | #114 | Exceptional 8.2% |
| Immigrants | Israel | 93.5 /100 | #115 | Exceptional 8.2% |
| South Africans | 93.4 /100 | #116 | Exceptional 8.2% |
| Immigrants | Russia | 93.2 /100 | #117 | Exceptional 8.2% |
| Immigrants | Western Europe | 92.9 /100 | #118 | Exceptional 8.2% |
Demographics Similar to Indonesians by Family Poverty
In terms of family poverty, the demographic groups most similar to Indonesians are Immigrants from Cuba (11.3%, a difference of 0.040%), Yaqui (11.3%, a difference of 0.12%), Barbadian (11.3%, a difference of 0.20%), Immigrants from West Indies (11.3%, a difference of 0.30%), and Belizean (11.3%, a difference of 0.57%).
| Demographics | Rating | Rank | Family Poverty |
| Immigrants | Guyana | 0.1 /100 | #276 | Tragic 11.2% |
| Chippewa | 0.1 /100 | #277 | Tragic 11.2% |
| Guyanese | 0.1 /100 | #278 | Tragic 11.2% |
| Blackfeet | 0.0 /100 | #279 | Tragic 11.3% |
| Belizeans | 0.0 /100 | #280 | Tragic 11.3% |
| Immigrants | West Indies | 0.0 /100 | #281 | Tragic 11.3% |
| Immigrants | Cuba | 0.0 /100 | #282 | Tragic 11.3% |
| Indonesians | 0.0 /100 | #283 | Tragic 11.3% |
| Yaqui | 0.0 /100 | #284 | Tragic 11.3% |
| Barbadians | 0.0 /100 | #285 | Tragic 11.3% |
| Senegalese | 0.0 /100 | #286 | Tragic 11.5% |
| Vietnamese | 0.0 /100 | #287 | Tragic 11.5% |
| Immigrants | Belize | 0.0 /100 | #288 | Tragic 11.5% |
| Immigrants | Barbados | 0.0 /100 | #289 | Tragic 11.5% |
| West Indians | 0.0 /100 | #290 | Tragic 11.5% |