Cape Verdean vs Immigrants from Kenya Seniors Poverty Over the Age of 65
COMPARE
Cape Verdean
Immigrants from Kenya
Seniors Poverty Over the Age of 65
Seniors Poverty Over the Age of 65 Comparison
Cape Verdeans
Immigrants from Kenya
14.7%
SENIORS POVERTY OVER THE AGE OF 65
0.0/ 100
METRIC RATING
319th/ 347
METRIC RANK
10.5%
SENIORS POVERTY OVER THE AGE OF 65
83.4/ 100
METRIC RATING
140th/ 347
METRIC RANK
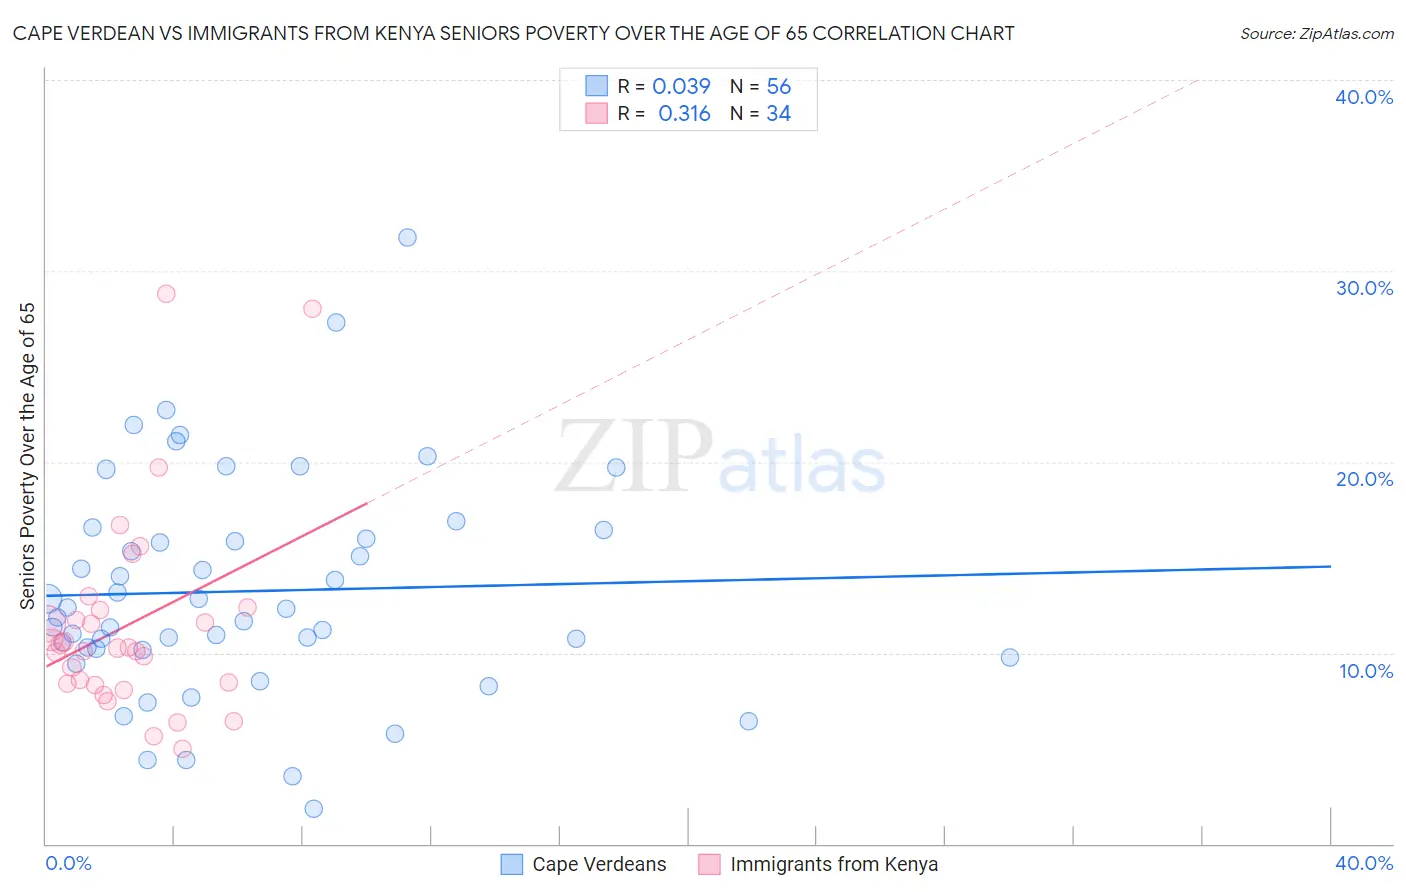
Cape Verdean vs Immigrants from Kenya Seniors Poverty Over the Age of 65 Correlation Chart
The statistical analysis conducted on geographies consisting of 107,426,458 people shows no correlation between the proportion of Cape Verdeans and poverty level among seniors over the age of 65 in the United States with a correlation coefficient (R) of 0.039 and weighted average of 14.7%. Similarly, the statistical analysis conducted on geographies consisting of 217,579,819 people shows a mild positive correlation between the proportion of Immigrants from Kenya and poverty level among seniors over the age of 65 in the United States with a correlation coefficient (R) of 0.316 and weighted average of 10.5%, a difference of 39.1%.
Seniors Poverty Over the Age of 65 Correlation Summary
| Measurement | Cape Verdean | Immigrants from Kenya |
| Minimum | 1.9% | 5.0% |
| Maximum | 31.7% | 28.8% |
| Range | 29.9% | 23.8% |
| Mean | 13.2% | 11.5% |
| Median | 12.1% | 10.3% |
| Interquartile 25% (IQ1) | 10.2% | 8.4% |
| Interquartile 75% (IQ3) | 16.2% | 12.3% |
| Interquartile Range (IQR) | 6.1% | 3.9% |
| Standard Deviation (Sample) | 5.8% | 5.3% |
| Standard Deviation (Population) | 5.8% | 5.2% |
Similar Demographics by Seniors Poverty Over the Age of 65
Demographics Similar to Cape Verdeans by Seniors Poverty Over the Age of 65
In terms of seniors poverty over the age of 65, the demographic groups most similar to Cape Verdeans are Immigrants from Haiti (14.7%, a difference of 0.18%), Houma (14.7%, a difference of 0.39%), Immigrants from Barbados (14.8%, a difference of 0.78%), Yakama (14.8%, a difference of 0.93%), and Immigrants from Honduras (14.5%, a difference of 1.2%).
| Demographics | Rating | Rank | Seniors Poverty Over the Age of 65 |
| Hispanics or Latinos | 0.0 /100 | #312 | Tragic 14.3% |
| Barbadians | 0.0 /100 | #313 | Tragic 14.4% |
| Guyanese | 0.0 /100 | #314 | Tragic 14.4% |
| Immigrants | Ecuador | 0.0 /100 | #315 | Tragic 14.4% |
| Immigrants | Guyana | 0.0 /100 | #316 | Tragic 14.5% |
| Haitians | 0.0 /100 | #317 | Tragic 14.5% |
| Immigrants | Honduras | 0.0 /100 | #318 | Tragic 14.5% |
| Cape Verdeans | 0.0 /100 | #319 | Tragic 14.7% |
| Immigrants | Haiti | 0.0 /100 | #320 | Tragic 14.7% |
| Houma | 0.0 /100 | #321 | Tragic 14.7% |
| Immigrants | Barbados | 0.0 /100 | #322 | Tragic 14.8% |
| Yakama | 0.0 /100 | #323 | Tragic 14.8% |
| Nicaraguans | 0.0 /100 | #324 | Tragic 15.0% |
| Central American Indians | 0.0 /100 | #325 | Tragic 15.1% |
| Immigrants | Armenia | 0.0 /100 | #326 | Tragic 15.2% |
Demographics Similar to Immigrants from Kenya by Seniors Poverty Over the Age of 65
In terms of seniors poverty over the age of 65, the demographic groups most similar to Immigrants from Kenya are Immigrants from Europe (10.5%, a difference of 0.020%), Osage (10.6%, a difference of 0.090%), Portuguese (10.5%, a difference of 0.13%), Immigrants from Latvia (10.5%, a difference of 0.23%), and Immigrants from Australia (10.5%, a difference of 0.29%).
| Demographics | Rating | Rank | Seniors Poverty Over the Age of 65 |
| Guamanians/Chamorros | 87.5 /100 | #133 | Excellent 10.5% |
| Sierra Leoneans | 86.8 /100 | #134 | Excellent 10.5% |
| Immigrants | Norway | 86.5 /100 | #135 | Excellent 10.5% |
| Immigrants | Serbia | 86.4 /100 | #136 | Excellent 10.5% |
| Immigrants | Australia | 85.1 /100 | #137 | Excellent 10.5% |
| Immigrants | Latvia | 84.7 /100 | #138 | Excellent 10.5% |
| Portuguese | 84.1 /100 | #139 | Excellent 10.5% |
| Immigrants | Kenya | 83.4 /100 | #140 | Excellent 10.5% |
| Immigrants | Europe | 83.3 /100 | #141 | Excellent 10.5% |
| Osage | 82.8 /100 | #142 | Excellent 10.6% |
| Immigrants | Asia | 80.8 /100 | #143 | Excellent 10.6% |
| Iraqis | 80.7 /100 | #144 | Excellent 10.6% |
| Laotians | 79.9 /100 | #145 | Good 10.6% |
| Alaskan Athabascans | 79.1 /100 | #146 | Good 10.6% |
| Immigrants | Greece | 79.0 /100 | #147 | Good 10.6% |