Cape Verdean vs Inupiat Seniors Poverty Over the Age of 65
COMPARE
Cape Verdean
Inupiat
Seniors Poverty Over the Age of 65
Seniors Poverty Over the Age of 65 Comparison
Cape Verdeans
Inupiat
14.7%
SENIORS POVERTY OVER THE AGE OF 65
0.0/ 100
METRIC RATING
319th/ 347
METRIC RANK
12.6%
SENIORS POVERTY OVER THE AGE OF 65
0.1/ 100
METRIC RATING
264th/ 347
METRIC RANK
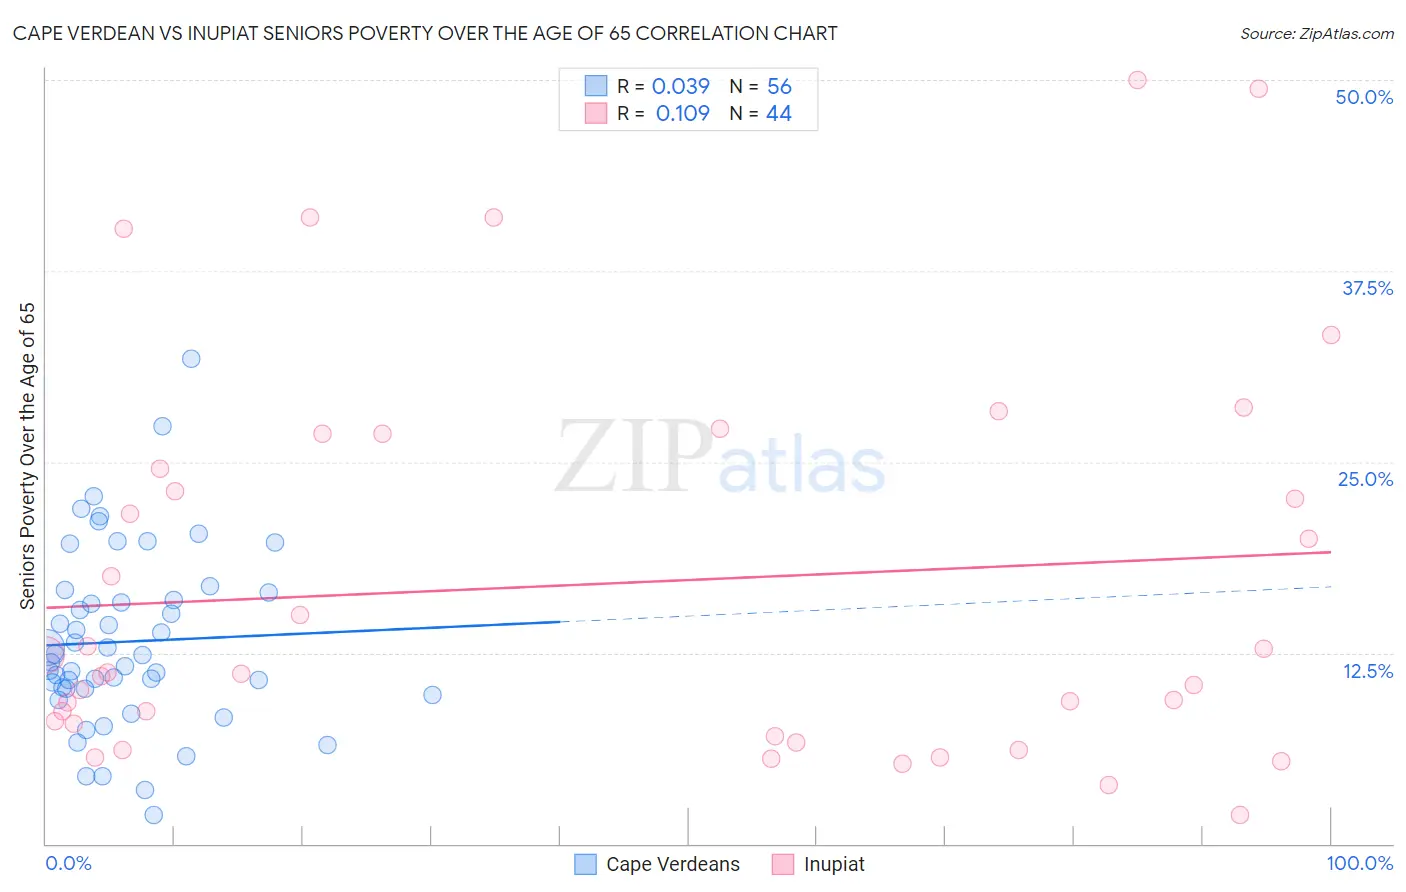
Cape Verdean vs Inupiat Seniors Poverty Over the Age of 65 Correlation Chart
The statistical analysis conducted on geographies consisting of 107,426,458 people shows no correlation between the proportion of Cape Verdeans and poverty level among seniors over the age of 65 in the United States with a correlation coefficient (R) of 0.039 and weighted average of 14.7%. Similarly, the statistical analysis conducted on geographies consisting of 96,149,524 people shows a poor positive correlation between the proportion of Inupiat and poverty level among seniors over the age of 65 in the United States with a correlation coefficient (R) of 0.109 and weighted average of 12.6%, a difference of 16.7%.
Seniors Poverty Over the Age of 65 Correlation Summary
| Measurement | Cape Verdean | Inupiat |
| Minimum | 1.9% | 1.9% |
| Maximum | 31.7% | 50.0% |
| Range | 29.9% | 48.1% |
| Mean | 13.2% | 17.0% |
| Median | 12.1% | 11.2% |
| Interquartile 25% (IQ1) | 10.2% | 7.5% |
| Interquartile 75% (IQ3) | 16.2% | 25.7% |
| Interquartile Range (IQR) | 6.1% | 18.2% |
| Standard Deviation (Sample) | 5.8% | 12.8% |
| Standard Deviation (Population) | 5.8% | 12.7% |
Similar Demographics by Seniors Poverty Over the Age of 65
Demographics Similar to Cape Verdeans by Seniors Poverty Over the Age of 65
In terms of seniors poverty over the age of 65, the demographic groups most similar to Cape Verdeans are Immigrants from Haiti (14.7%, a difference of 0.18%), Houma (14.7%, a difference of 0.39%), Immigrants from Barbados (14.8%, a difference of 0.78%), Yakama (14.8%, a difference of 0.93%), and Immigrants from Honduras (14.5%, a difference of 1.2%).
| Demographics | Rating | Rank | Seniors Poverty Over the Age of 65 |
| Hispanics or Latinos | 0.0 /100 | #312 | Tragic 14.3% |
| Barbadians | 0.0 /100 | #313 | Tragic 14.4% |
| Guyanese | 0.0 /100 | #314 | Tragic 14.4% |
| Immigrants | Ecuador | 0.0 /100 | #315 | Tragic 14.4% |
| Immigrants | Guyana | 0.0 /100 | #316 | Tragic 14.5% |
| Haitians | 0.0 /100 | #317 | Tragic 14.5% |
| Immigrants | Honduras | 0.0 /100 | #318 | Tragic 14.5% |
| Cape Verdeans | 0.0 /100 | #319 | Tragic 14.7% |
| Immigrants | Haiti | 0.0 /100 | #320 | Tragic 14.7% |
| Houma | 0.0 /100 | #321 | Tragic 14.7% |
| Immigrants | Barbados | 0.0 /100 | #322 | Tragic 14.8% |
| Yakama | 0.0 /100 | #323 | Tragic 14.8% |
| Nicaraguans | 0.0 /100 | #324 | Tragic 15.0% |
| Central American Indians | 0.0 /100 | #325 | Tragic 15.1% |
| Immigrants | Armenia | 0.0 /100 | #326 | Tragic 15.2% |
Demographics Similar to Inupiat by Seniors Poverty Over the Age of 65
In terms of seniors poverty over the age of 65, the demographic groups most similar to Inupiat are Soviet Union (12.6%, a difference of 0.070%), Immigrants from Western Africa (12.6%, a difference of 0.090%), Venezuelan (12.5%, a difference of 0.23%), African (12.6%, a difference of 0.26%), and Blackfeet (12.6%, a difference of 0.40%).
| Demographics | Rating | Rank | Seniors Poverty Over the Age of 65 |
| Immigrants | Immigrants | 0.2 /100 | #257 | Tragic 12.4% |
| Dutch West Indians | 0.2 /100 | #258 | Tragic 12.4% |
| Ghanaians | 0.2 /100 | #259 | Tragic 12.4% |
| South Americans | 0.2 /100 | #260 | Tragic 12.5% |
| Colombians | 0.2 /100 | #261 | Tragic 12.5% |
| Venezuelans | 0.1 /100 | #262 | Tragic 12.5% |
| Soviet Union | 0.1 /100 | #263 | Tragic 12.6% |
| Inupiat | 0.1 /100 | #264 | Tragic 12.6% |
| Immigrants | Western Africa | 0.1 /100 | #265 | Tragic 12.6% |
| Africans | 0.1 /100 | #266 | Tragic 12.6% |
| Blackfeet | 0.1 /100 | #267 | Tragic 12.6% |
| Immigrants | Somalia | 0.1 /100 | #268 | Tragic 12.6% |
| Immigrants | Venezuela | 0.1 /100 | #269 | Tragic 12.7% |
| Immigrants | South America | 0.1 /100 | #270 | Tragic 12.7% |
| Immigrants | Ghana | 0.1 /100 | #271 | Tragic 12.8% |