Canadian vs Immigrants from Croatia Female Poverty Among 18-24 Year Olds
COMPARE
Canadian
Immigrants from Croatia
Female Poverty Among 18-24 Year Olds
Female Poverty Among 18-24 Year Olds Comparison
Canadians
Immigrants from Croatia
19.7%
FEMALE POVERTY AMONG 18-24 YEAR OLDS
83.8/ 100
METRIC RATING
145th/ 347
METRIC RANK
17.9%
FEMALE POVERTY AMONG 18-24 YEAR OLDS
100.0/ 100
METRIC RATING
37th/ 347
METRIC RANK
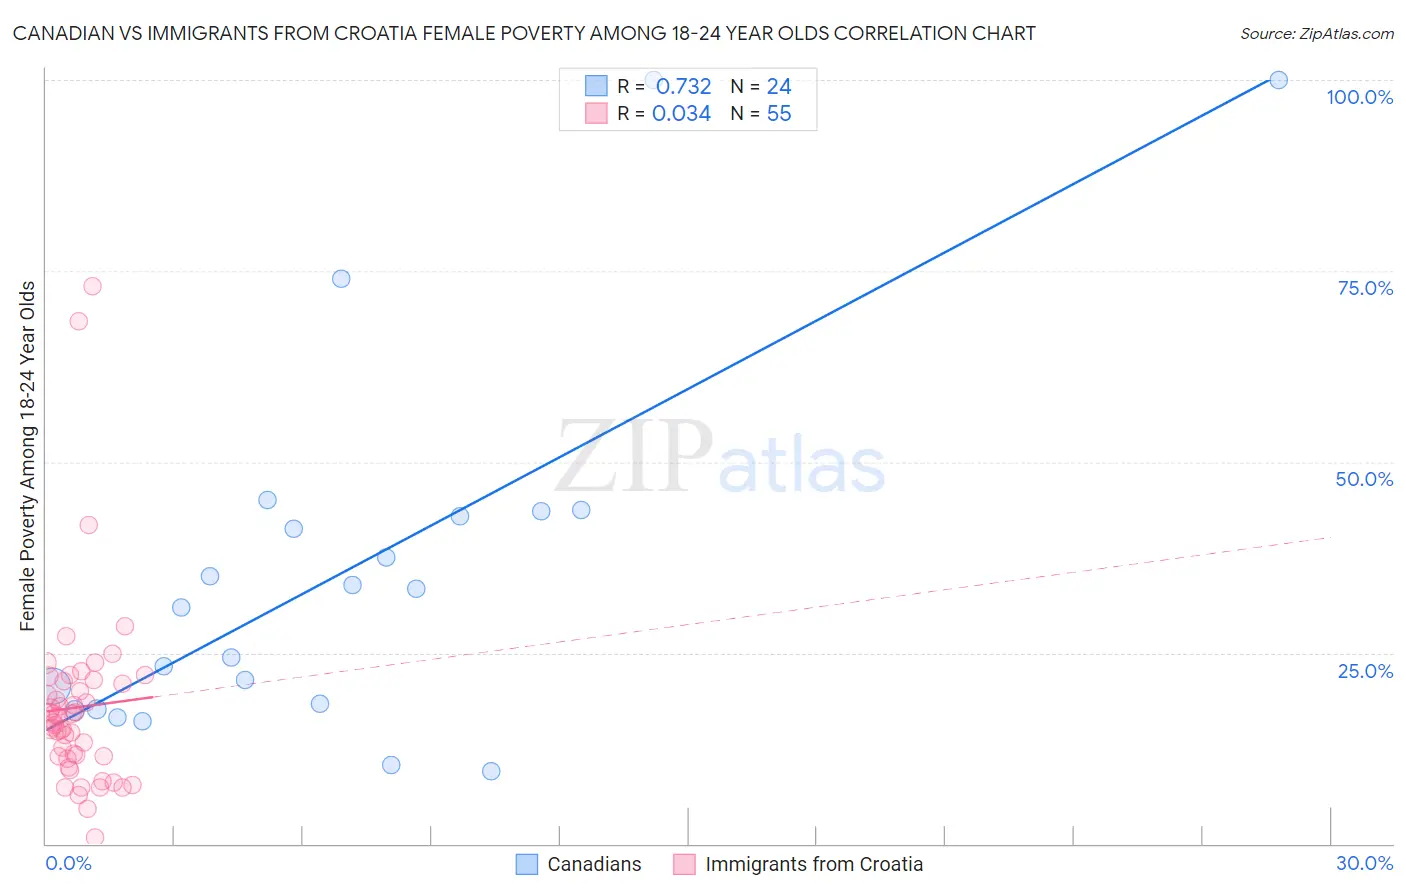
Canadian vs Immigrants from Croatia Female Poverty Among 18-24 Year Olds Correlation Chart
The statistical analysis conducted on geographies consisting of 422,696,496 people shows a strong positive correlation between the proportion of Canadians and poverty level among females between the ages 18 and 24 in the United States with a correlation coefficient (R) of 0.732 and weighted average of 19.7%. Similarly, the statistical analysis conducted on geographies consisting of 130,966,155 people shows no correlation between the proportion of Immigrants from Croatia and poverty level among females between the ages 18 and 24 in the United States with a correlation coefficient (R) of 0.034 and weighted average of 17.9%, a difference of 10.0%.
Female Poverty Among 18-24 Year Olds Correlation Summary
| Measurement | Canadian | Immigrants from Croatia |
| Minimum | 9.5% | 0.75% |
| Maximum | 100.0% | 73.0% |
| Range | 90.5% | 72.3% |
| Mean | 35.7% | 17.9% |
| Median | 32.2% | 15.8% |
| Interquartile 25% (IQ1) | 17.9% | 11.4% |
| Interquartile 75% (IQ3) | 43.2% | 21.3% |
| Interquartile Range (IQR) | 25.3% | 9.9% |
| Standard Deviation (Sample) | 24.5% | 12.5% |
| Standard Deviation (Population) | 24.0% | 12.4% |
Similar Demographics by Female Poverty Among 18-24 Year Olds
Demographics Similar to Canadians by Female Poverty Among 18-24 Year Olds
In terms of female poverty among 18-24 year olds, the demographic groups most similar to Canadians are Immigrants from Bosnia and Herzegovina (19.7%, a difference of 0.020%), Immigrants from Northern Africa (19.7%, a difference of 0.030%), Slavic (19.7%, a difference of 0.060%), Immigrants from Austria (19.7%, a difference of 0.060%), and Panamanian (19.7%, a difference of 0.070%).
| Demographics | Rating | Rank | Female Poverty Among 18-24 Year Olds |
| Immigrants | Morocco | 89.9 /100 | #138 | Excellent 19.6% |
| Indians (Asian) | 88.3 /100 | #139 | Excellent 19.6% |
| Immigrants | Trinidad and Tobago | 85.6 /100 | #140 | Excellent 19.7% |
| Pennsylvania Germans | 85.5 /100 | #141 | Excellent 19.7% |
| Panamanians | 84.6 /100 | #142 | Excellent 19.7% |
| Slavs | 84.4 /100 | #143 | Excellent 19.7% |
| Immigrants | Northern Africa | 84.1 /100 | #144 | Excellent 19.7% |
| Canadians | 83.8 /100 | #145 | Excellent 19.7% |
| Immigrants | Bosnia and Herzegovina | 83.6 /100 | #146 | Excellent 19.7% |
| Immigrants | Austria | 83.1 /100 | #147 | Excellent 19.7% |
| Immigrants | Latin America | 81.3 /100 | #148 | Excellent 19.7% |
| Immigrants | Oceania | 81.2 /100 | #149 | Excellent 19.7% |
| Syrians | 80.2 /100 | #150 | Excellent 19.8% |
| Immigrants | Eastern Asia | 79.7 /100 | #151 | Good 19.8% |
| Yugoslavians | 79.0 /100 | #152 | Good 19.8% |
Demographics Similar to Immigrants from Croatia by Female Poverty Among 18-24 Year Olds
In terms of female poverty among 18-24 year olds, the demographic groups most similar to Immigrants from Croatia are Immigrants from South America (17.9%, a difference of 0.060%), Immigrants from Greece (17.9%, a difference of 0.11%), Immigrants from Nicaragua (17.9%, a difference of 0.14%), South American (18.0%, a difference of 0.22%), and Native Hawaiian (17.9%, a difference of 0.26%).
| Demographics | Rating | Rank | Female Poverty Among 18-24 Year Olds |
| Immigrants | South Eastern Asia | 100.0 /100 | #30 | Exceptional 17.8% |
| Immigrants | Vietnam | 100.0 /100 | #31 | Exceptional 17.8% |
| Immigrants | Moldova | 100.0 /100 | #32 | Exceptional 17.9% |
| Native Hawaiians | 100.0 /100 | #33 | Exceptional 17.9% |
| Immigrants | Nicaragua | 100.0 /100 | #34 | Exceptional 17.9% |
| Immigrants | Greece | 100.0 /100 | #35 | Exceptional 17.9% |
| Immigrants | South America | 100.0 /100 | #36 | Exceptional 17.9% |
| Immigrants | Croatia | 100.0 /100 | #37 | Exceptional 17.9% |
| South Americans | 100.0 /100 | #38 | Exceptional 18.0% |
| Puget Sound Salish | 100.0 /100 | #39 | Exceptional 18.0% |
| Immigrants | Romania | 100.0 /100 | #40 | Exceptional 18.0% |
| Immigrants | Argentina | 100.0 /100 | #41 | Exceptional 18.0% |
| Bulgarians | 100.0 /100 | #42 | Exceptional 18.1% |
| Macedonians | 100.0 /100 | #43 | Exceptional 18.1% |
| Nicaraguans | 100.0 /100 | #44 | Exceptional 18.1% |