Immigrants from Hungary vs Immigrants from Grenada Female Poverty Among 18-24 Year Olds
COMPARE
Immigrants from Hungary
Immigrants from Grenada
Female Poverty Among 18-24 Year Olds
Female Poverty Among 18-24 Year Olds Comparison
Immigrants from Hungary
Immigrants from Grenada
19.3%
FEMALE POVERTY AMONG 18-24 YEAR OLDS
96.2/ 100
METRIC RATING
115th/ 347
METRIC RANK
21.2%
FEMALE POVERTY AMONG 18-24 YEAR OLDS
1.2/ 100
METRIC RATING
255th/ 347
METRIC RANK
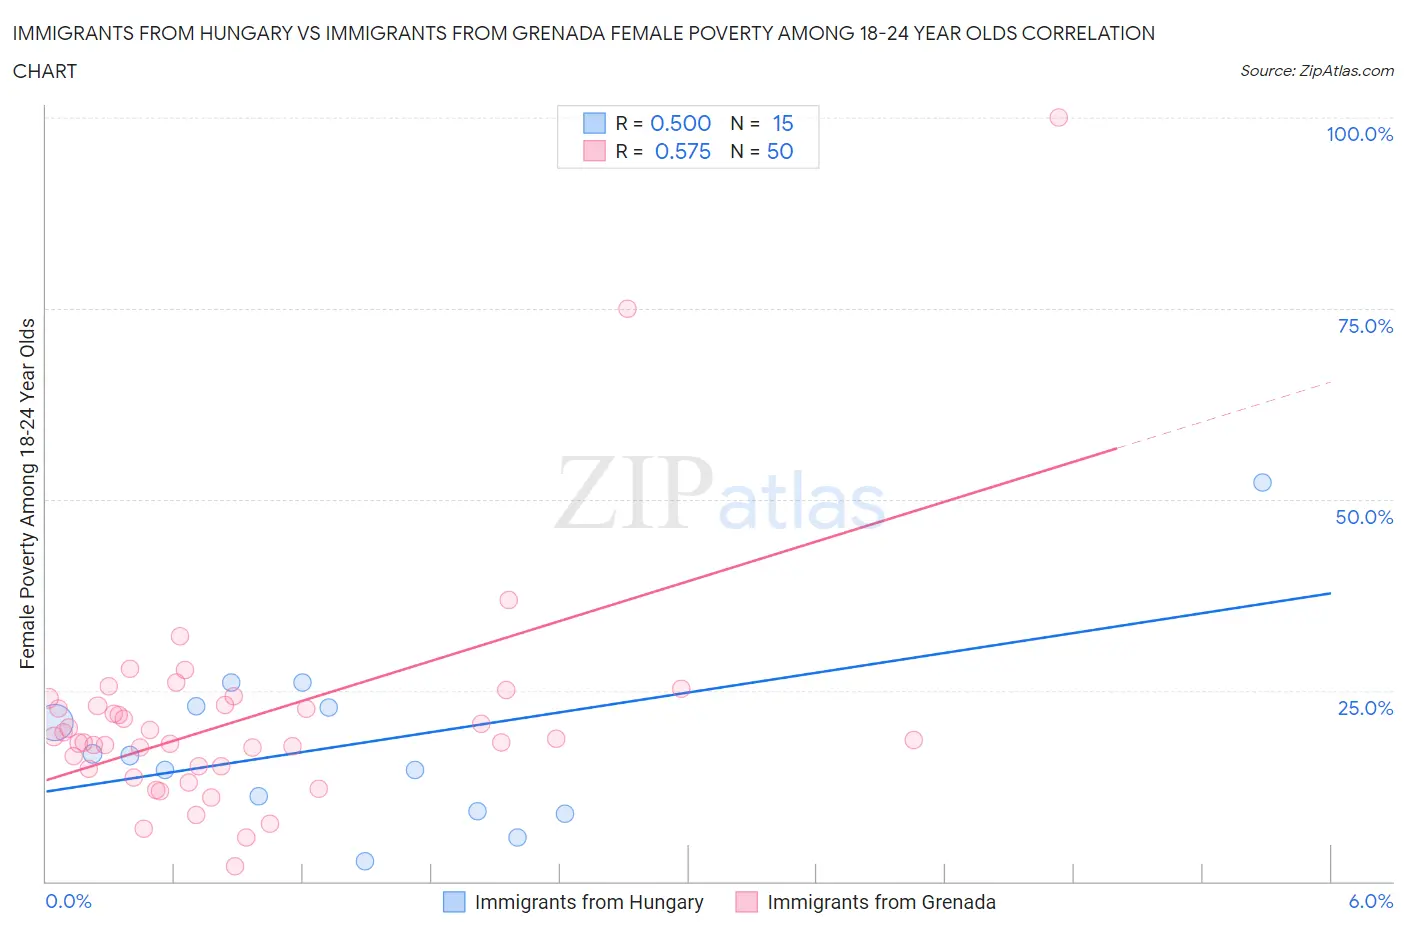
Immigrants from Hungary vs Immigrants from Grenada Female Poverty Among 18-24 Year Olds Correlation Chart
The statistical analysis conducted on geographies consisting of 192,436,137 people shows a moderate positive correlation between the proportion of Immigrants from Hungary and poverty level among females between the ages 18 and 24 in the United States with a correlation coefficient (R) of 0.500 and weighted average of 19.3%. Similarly, the statistical analysis conducted on geographies consisting of 66,763,632 people shows a substantial positive correlation between the proportion of Immigrants from Grenada and poverty level among females between the ages 18 and 24 in the United States with a correlation coefficient (R) of 0.575 and weighted average of 21.2%, a difference of 9.8%.
Female Poverty Among 18-24 Year Olds Correlation Summary
| Measurement | Immigrants from Hungary | Immigrants from Grenada |
| Minimum | 2.6% | 2.0% |
| Maximum | 52.2% | 100.0% |
| Range | 49.6% | 98.0% |
| Mean | 18.0% | 21.4% |
| Median | 16.5% | 18.6% |
| Interquartile 25% (IQ1) | 9.2% | 15.0% |
| Interquartile 75% (IQ3) | 23.0% | 23.1% |
| Interquartile Range (IQR) | 13.7% | 8.1% |
| Standard Deviation (Sample) | 11.9% | 15.4% |
| Standard Deviation (Population) | 11.5% | 15.2% |
Similar Demographics by Female Poverty Among 18-24 Year Olds
Demographics Similar to Immigrants from Hungary by Female Poverty Among 18-24 Year Olds
In terms of female poverty among 18-24 year olds, the demographic groups most similar to Immigrants from Hungary are Slovene (19.3%, a difference of 0.010%), Immigrants from Cameroon (19.3%, a difference of 0.050%), Immigrants (19.3%, a difference of 0.10%), Immigrants from El Salvador (19.3%, a difference of 0.11%), and Immigrants from Iran (19.3%, a difference of 0.14%).
| Demographics | Rating | Rank | Female Poverty Among 18-24 Year Olds |
| Immigrants | Uzbekistan | 97.3 /100 | #108 | Exceptional 19.2% |
| Immigrants | Syria | 97.2 /100 | #109 | Exceptional 19.2% |
| Laotians | 97.1 /100 | #110 | Exceptional 19.2% |
| Immigrants | Serbia | 97.1 /100 | #111 | Exceptional 19.2% |
| Immigrants | El Salvador | 96.5 /100 | #112 | Exceptional 19.3% |
| Immigrants | Cameroon | 96.3 /100 | #113 | Exceptional 19.3% |
| Slovenes | 96.2 /100 | #114 | Exceptional 19.3% |
| Immigrants | Hungary | 96.2 /100 | #115 | Exceptional 19.3% |
| Immigrants | Immigrants | 95.9 /100 | #116 | Exceptional 19.3% |
| Immigrants | Iran | 95.8 /100 | #117 | Exceptional 19.3% |
| Immigrants | Guyana | 95.6 /100 | #118 | Exceptional 19.3% |
| Cypriots | 95.5 /100 | #119 | Exceptional 19.3% |
| Immigrants | Northern Europe | 95.4 /100 | #120 | Exceptional 19.4% |
| Guyanese | 95.3 /100 | #121 | Exceptional 19.4% |
| Cambodians | 94.6 /100 | #122 | Exceptional 19.4% |
Demographics Similar to Immigrants from Grenada by Female Poverty Among 18-24 Year Olds
In terms of female poverty among 18-24 year olds, the demographic groups most similar to Immigrants from Grenada are British West Indian (21.2%, a difference of 0.030%), Tsimshian (21.2%, a difference of 0.15%), Taiwanese (21.2%, a difference of 0.26%), Delaware (21.1%, a difference of 0.32%), and South African (21.1%, a difference of 0.36%).
| Demographics | Rating | Rank | Female Poverty Among 18-24 Year Olds |
| Immigrants | Kenya | 2.5 /100 | #248 | Tragic 21.0% |
| Carpatho Rusyns | 2.5 /100 | #249 | Tragic 21.0% |
| Immigrants | West Indies | 2.2 /100 | #250 | Tragic 21.0% |
| West Indians | 1.9 /100 | #251 | Tragic 21.1% |
| South Africans | 1.6 /100 | #252 | Tragic 21.1% |
| Delaware | 1.6 /100 | #253 | Tragic 21.1% |
| British West Indians | 1.2 /100 | #254 | Tragic 21.2% |
| Immigrants | Grenada | 1.2 /100 | #255 | Tragic 21.2% |
| Tsimshian | 1.0 /100 | #256 | Tragic 21.2% |
| Taiwanese | 1.0 /100 | #257 | Tragic 21.2% |
| Vietnamese | 0.6 /100 | #258 | Tragic 21.4% |
| Immigrants | France | 0.6 /100 | #259 | Tragic 21.4% |
| Immigrants | Norway | 0.6 /100 | #260 | Tragic 21.4% |
| Immigrants | Bahamas | 0.5 /100 | #261 | Tragic 21.4% |
| Immigrants | Eastern Africa | 0.4 /100 | #262 | Tragic 21.4% |