Uruguayan vs Basque Child Poverty Under the Age of 16
COMPARE
Uruguayan
Basque
Child Poverty Under the Age of 16
Child Poverty Under the Age of 16 Comparison
Uruguayans
Basques
16.1%
CHILD POVERTY UNDER THE AGE OF 16
54.7/ 100
METRIC RATING
169th/ 347
METRIC RANK
14.8%
CHILD POVERTY UNDER THE AGE OF 16
94.7/ 100
METRIC RATING
105th/ 347
METRIC RANK
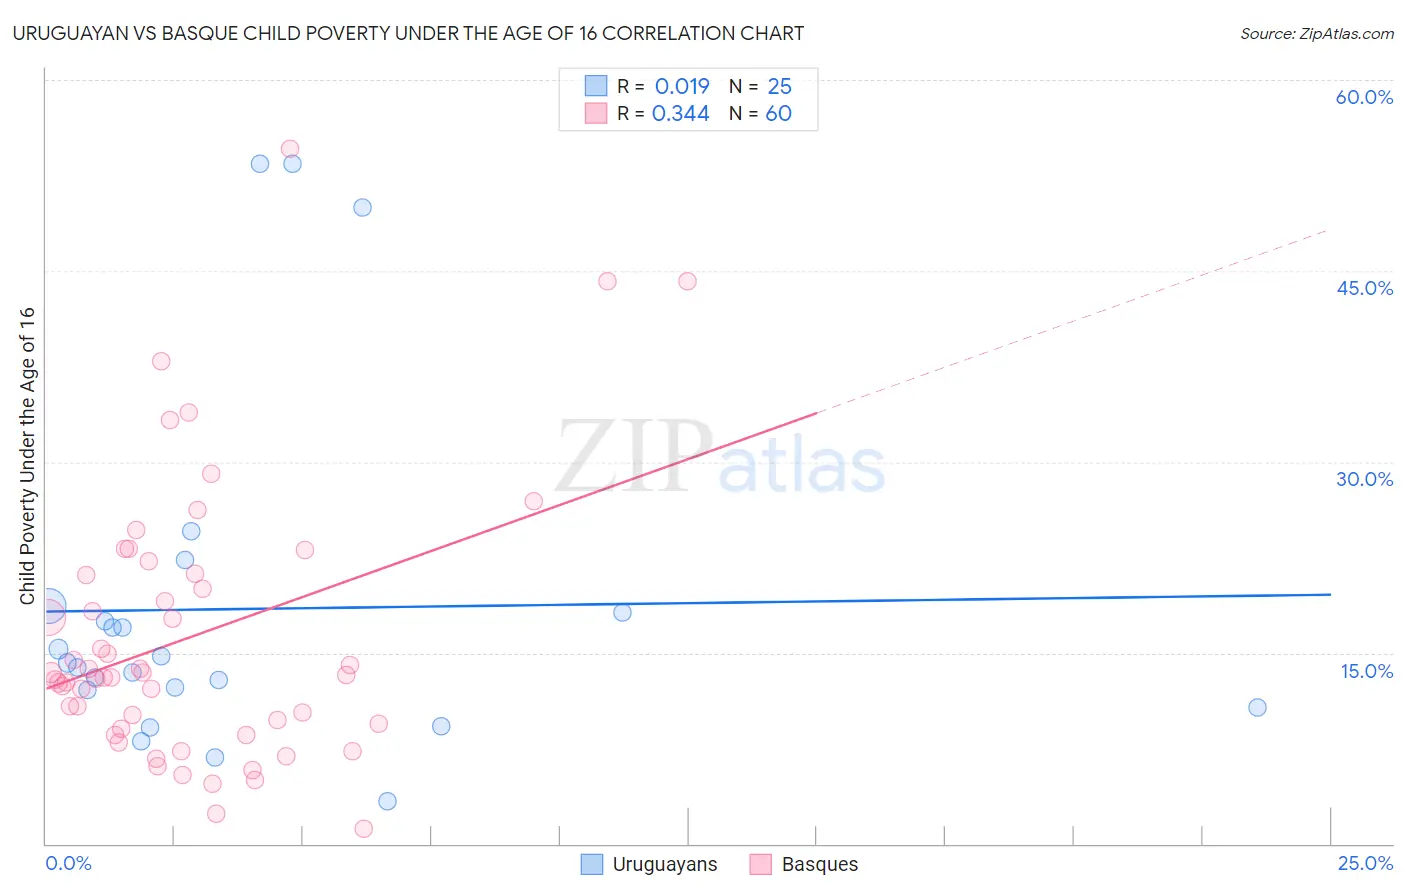
Uruguayan vs Basque Child Poverty Under the Age of 16 Correlation Chart
The statistical analysis conducted on geographies consisting of 144,396,450 people shows no correlation between the proportion of Uruguayans and poverty level among children under the age of 16 in the United States with a correlation coefficient (R) of 0.019 and weighted average of 16.1%. Similarly, the statistical analysis conducted on geographies consisting of 165,163,292 people shows a mild positive correlation between the proportion of Basques and poverty level among children under the age of 16 in the United States with a correlation coefficient (R) of 0.344 and weighted average of 14.8%, a difference of 8.8%.
Child Poverty Under the Age of 16 Correlation Summary
| Measurement | Uruguayan | Basque |
| Minimum | 3.3% | 1.2% |
| Maximum | 53.4% | 54.6% |
| Range | 50.1% | 53.4% |
| Mean | 18.4% | 16.3% |
| Median | 14.2% | 13.2% |
| Interquartile 25% (IQ1) | 11.4% | 9.2% |
| Interquartile 75% (IQ3) | 18.4% | 21.1% |
| Interquartile Range (IQR) | 7.0% | 11.9% |
| Standard Deviation (Sample) | 13.6% | 10.7% |
| Standard Deviation (Population) | 13.3% | 10.6% |
Similar Demographics by Child Poverty Under the Age of 16
Demographics Similar to Uruguayans by Child Poverty Under the Age of 16
In terms of child poverty under the age of 16, the demographic groups most similar to Uruguayans are Immigrants from Colombia (16.1%, a difference of 0.040%), Hungarian (16.2%, a difference of 0.27%), Afghan (16.2%, a difference of 0.29%), Immigrants from Saudi Arabia (16.2%, a difference of 0.31%), and South American (16.0%, a difference of 0.40%).
| Demographics | Rating | Rank | Child Poverty Under the Age of 16 |
| Colombians | 67.6 /100 | #162 | Good 15.8% |
| Yugoslavians | 67.6 /100 | #163 | Good 15.8% |
| Immigrants | Germany | 67.3 /100 | #164 | Good 15.8% |
| Guamanians/Chamorros | 66.4 /100 | #165 | Good 15.9% |
| Immigrants | Oceania | 65.4 /100 | #166 | Good 15.9% |
| Costa Ricans | 61.1 /100 | #167 | Good 16.0% |
| South Americans | 57.9 /100 | #168 | Average 16.0% |
| Uruguayans | 54.7 /100 | #169 | Average 16.1% |
| Immigrants | Colombia | 54.4 /100 | #170 | Average 16.1% |
| Hungarians | 52.5 /100 | #171 | Average 16.2% |
| Afghans | 52.3 /100 | #172 | Average 16.2% |
| Immigrants | Saudi Arabia | 52.1 /100 | #173 | Average 16.2% |
| Whites/Caucasians | 50.0 /100 | #174 | Average 16.2% |
| Scotch-Irish | 47.1 /100 | #175 | Average 16.3% |
| Lebanese | 45.9 /100 | #176 | Average 16.3% |
Demographics Similar to Basques by Child Poverty Under the Age of 16
In terms of child poverty under the age of 16, the demographic groups most similar to Basques are Immigrants from England (14.8%, a difference of 0.11%), Serbian (14.8%, a difference of 0.13%), Immigrants from Egypt (14.8%, a difference of 0.15%), Chilean (14.8%, a difference of 0.19%), and Romanian (14.8%, a difference of 0.20%).
| Demographics | Rating | Rank | Child Poverty Under the Age of 16 |
| Immigrants | Belarus | 95.7 /100 | #98 | Exceptional 14.7% |
| British | 95.5 /100 | #99 | Exceptional 14.7% |
| Dutch | 95.1 /100 | #100 | Exceptional 14.8% |
| Immigrants | Switzerland | 95.1 /100 | #101 | Exceptional 14.8% |
| Romanians | 95.0 /100 | #102 | Exceptional 14.8% |
| Immigrants | Egypt | 94.9 /100 | #103 | Exceptional 14.8% |
| Immigrants | England | 94.8 /100 | #104 | Exceptional 14.8% |
| Basques | 94.7 /100 | #105 | Exceptional 14.8% |
| Serbians | 94.5 /100 | #106 | Exceptional 14.8% |
| Chileans | 94.4 /100 | #107 | Exceptional 14.8% |
| Jordanians | 94.2 /100 | #108 | Exceptional 14.8% |
| Tlingit-Haida | 94.1 /100 | #109 | Exceptional 14.9% |
| English | 93.5 /100 | #110 | Exceptional 14.9% |
| Immigrants | Denmark | 93.5 /100 | #111 | Exceptional 14.9% |
| Irish | 93.4 /100 | #112 | Exceptional 14.9% |