Cambodian vs Immigrants from Bahamas Births to Unmarried Women
COMPARE
Cambodian
Immigrants from Bahamas
Births to Unmarried Women
Births to Unmarried Women Comparison
Cambodians
Immigrants from Bahamas
26.7%
BIRTHS TO UNMARRIED WOMEN
99.9/ 100
METRIC RATING
25th/ 347
METRIC RANK
40.1%
BIRTHS TO UNMARRIED WOMEN
0.0/ 100
METRIC RATING
318th/ 347
METRIC RANK
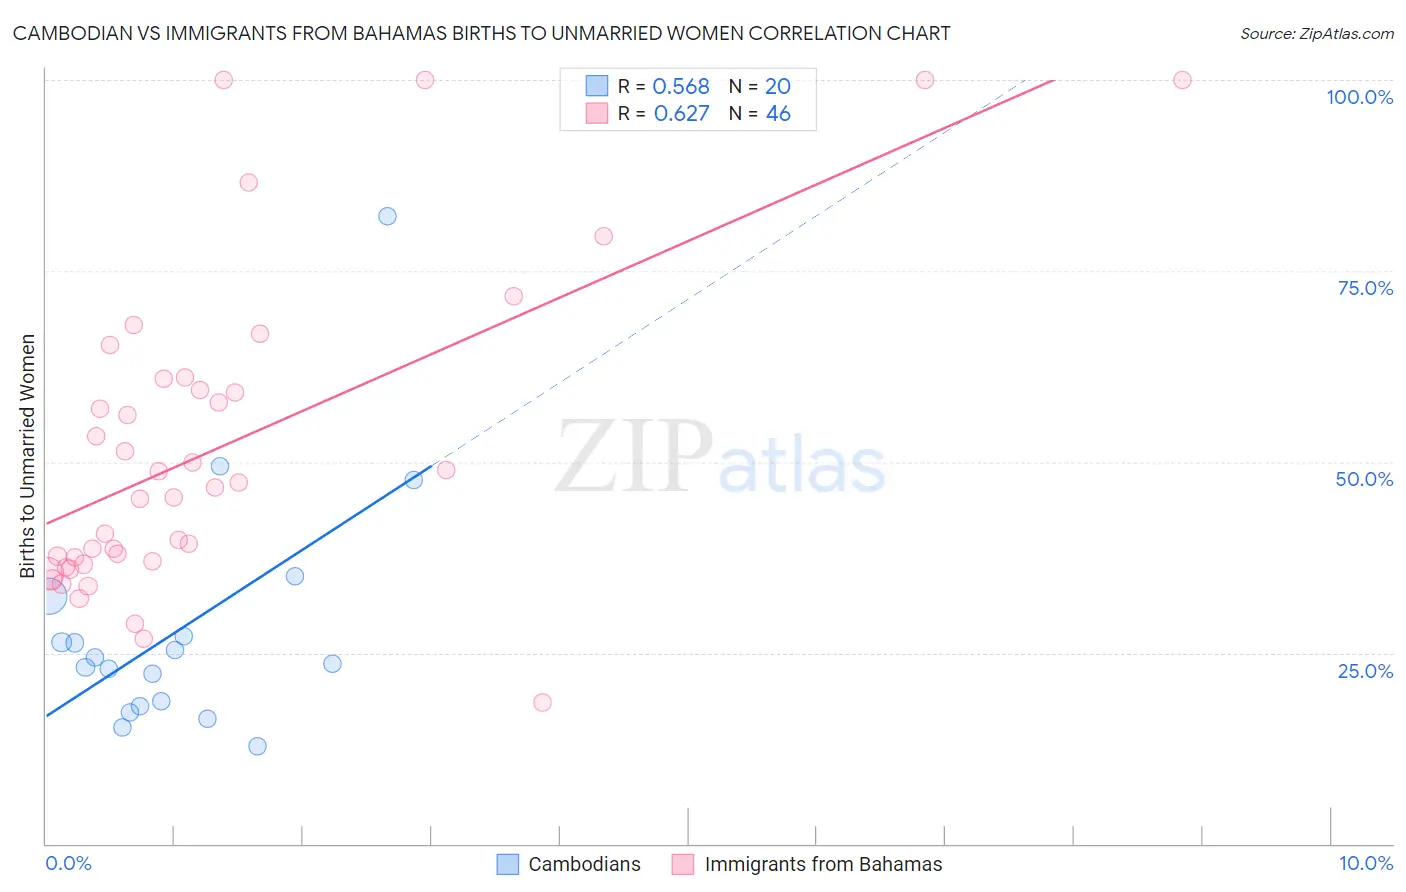
Cambodian vs Immigrants from Bahamas Births to Unmarried Women Correlation Chart
The statistical analysis conducted on geographies consisting of 99,884,010 people shows a substantial positive correlation between the proportion of Cambodians and percentage of births to unmarried women in the United States with a correlation coefficient (R) of 0.568 and weighted average of 26.7%. Similarly, the statistical analysis conducted on geographies consisting of 103,055,032 people shows a significant positive correlation between the proportion of Immigrants from Bahamas and percentage of births to unmarried women in the United States with a correlation coefficient (R) of 0.627 and weighted average of 40.1%, a difference of 50.3%.
Births to Unmarried Women Correlation Summary
| Measurement | Cambodian | Immigrants from Bahamas |
| Minimum | 12.7% | 18.5% |
| Maximum | 82.1% | 100.0% |
| Range | 69.4% | 81.5% |
| Mean | 28.3% | 51.9% |
| Median | 23.9% | 47.0% |
| Interquartile 25% (IQ1) | 18.4% | 37.0% |
| Interquartile 75% (IQ3) | 29.7% | 60.9% |
| Interquartile Range (IQR) | 11.3% | 23.9% |
| Standard Deviation (Sample) | 15.9% | 20.6% |
| Standard Deviation (Population) | 15.5% | 20.3% |
Similar Demographics by Births to Unmarried Women
Demographics Similar to Cambodians by Births to Unmarried Women
In terms of births to unmarried women, the demographic groups most similar to Cambodians are Immigrants from Australia (26.6%, a difference of 0.21%), Asian (26.8%, a difference of 0.39%), Immigrants from Asia (26.8%, a difference of 0.40%), Okinawan (26.9%, a difference of 0.91%), and Immigrants from Japan (26.4%, a difference of 1.0%).
| Demographics | Rating | Rank | Births to Unmarried Women |
| Immigrants | Armenia | 99.9 /100 | #18 | Exceptional 26.1% |
| Armenians | 99.9 /100 | #19 | Exceptional 26.2% |
| Immigrants | Korea | 99.9 /100 | #20 | Exceptional 26.3% |
| Soviet Union | 99.9 /100 | #21 | Exceptional 26.3% |
| Burmese | 99.9 /100 | #22 | Exceptional 26.4% |
| Immigrants | Japan | 99.9 /100 | #23 | Exceptional 26.4% |
| Immigrants | Australia | 99.9 /100 | #24 | Exceptional 26.6% |
| Cambodians | 99.9 /100 | #25 | Exceptional 26.7% |
| Asians | 99.9 /100 | #26 | Exceptional 26.8% |
| Immigrants | Asia | 99.9 /100 | #27 | Exceptional 26.8% |
| Okinawans | 99.8 /100 | #28 | Exceptional 26.9% |
| Cypriots | 99.8 /100 | #29 | Exceptional 27.0% |
| Bulgarians | 99.8 /100 | #30 | Exceptional 27.1% |
| Immigrants | Iraq | 99.8 /100 | #31 | Exceptional 27.1% |
| Immigrants | Russia | 99.8 /100 | #32 | Exceptional 27.1% |
Demographics Similar to Immigrants from Bahamas by Births to Unmarried Women
In terms of births to unmarried women, the demographic groups most similar to Immigrants from Bahamas are Immigrants from Dominican Republic (40.1%, a difference of 0.070%), Yakama (40.3%, a difference of 0.56%), Crow (40.4%, a difference of 0.61%), Apache (39.9%, a difference of 0.62%), and Dominican (39.8%, a difference of 0.68%).
| Demographics | Rating | Rank | Births to Unmarried Women |
| Immigrants | Azores | 0.0 /100 | #311 | Tragic 39.6% |
| U.S. Virgin Islanders | 0.0 /100 | #312 | Tragic 39.6% |
| Africans | 0.0 /100 | #313 | Tragic 39.7% |
| Immigrants | Caribbean | 0.0 /100 | #314 | Tragic 39.8% |
| Dominicans | 0.0 /100 | #315 | Tragic 39.8% |
| Apache | 0.0 /100 | #316 | Tragic 39.9% |
| Immigrants | Dominican Republic | 0.0 /100 | #317 | Tragic 40.1% |
| Immigrants | Bahamas | 0.0 /100 | #318 | Tragic 40.1% |
| Yakama | 0.0 /100 | #319 | Tragic 40.3% |
| Crow | 0.0 /100 | #320 | Tragic 40.4% |
| Bahamians | 0.0 /100 | #321 | Tragic 40.8% |
| Cajuns | 0.0 /100 | #322 | Tragic 41.0% |
| Sioux | 0.0 /100 | #323 | Tragic 41.0% |
| Cape Verdeans | 0.0 /100 | #324 | Tragic 41.3% |
| Cheyenne | 0.0 /100 | #325 | Tragic 41.3% |