Cambodian vs Ecuadorian Family Poverty
COMPARE
Cambodian
Ecuadorian
Family Poverty
Family Poverty Comparison
Cambodians
Ecuadorians
7.8%
FAMILY POVERTY
98.2/ 100
METRIC RATING
71st/ 347
METRIC RANK
10.8%
FAMILY POVERTY
0.2/ 100
METRIC RATING
254th/ 347
METRIC RANK
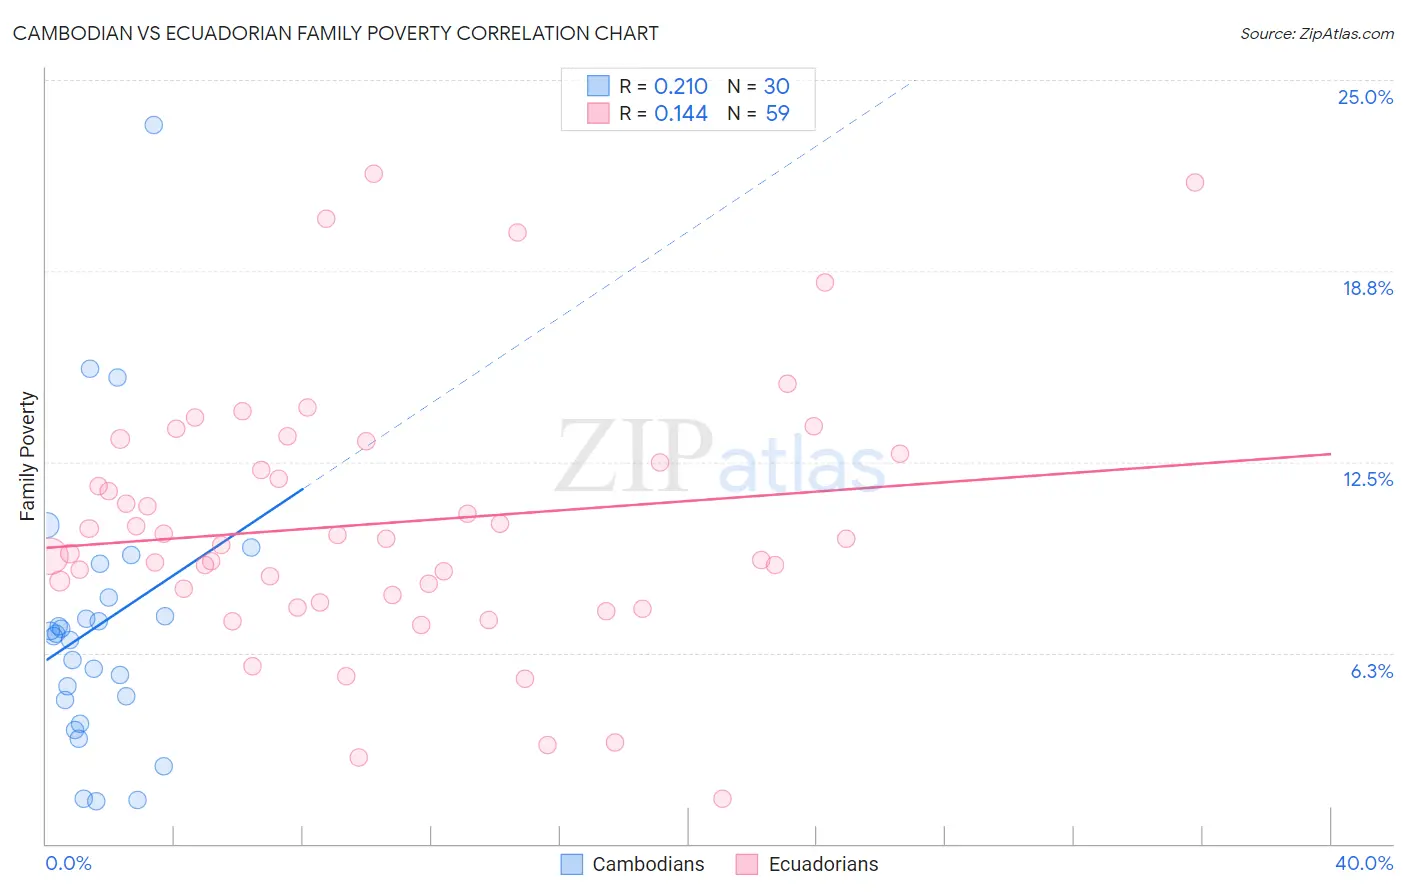
Cambodian vs Ecuadorian Family Poverty Correlation Chart
The statistical analysis conducted on geographies consisting of 102,420,102 people shows a weak positive correlation between the proportion of Cambodians and poverty level among families in the United States with a correlation coefficient (R) of 0.210 and weighted average of 7.8%. Similarly, the statistical analysis conducted on geographies consisting of 317,108,203 people shows a poor positive correlation between the proportion of Ecuadorians and poverty level among families in the United States with a correlation coefficient (R) of 0.144 and weighted average of 10.8%, a difference of 37.7%.
Family Poverty Correlation Summary
| Measurement | Cambodian | Ecuadorian |
| Minimum | 1.4% | 1.5% |
| Maximum | 23.5% | 21.9% |
| Range | 22.1% | 20.5% |
| Mean | 7.2% | 10.5% |
| Median | 6.8% | 10.0% |
| Interquartile 25% (IQ1) | 4.7% | 8.1% |
| Interquartile 75% (IQ3) | 8.0% | 12.8% |
| Interquartile Range (IQR) | 3.3% | 4.6% |
| Standard Deviation (Sample) | 4.6% | 4.2% |
| Standard Deviation (Population) | 4.5% | 4.2% |
Similar Demographics by Family Poverty
Demographics Similar to Cambodians by Family Poverty
In terms of family poverty, the demographic groups most similar to Cambodians are Immigrants from Canada (7.8%, a difference of 0.020%), Immigrants from Belgium (7.8%, a difference of 0.060%), Immigrants from Romania (7.8%, a difference of 0.060%), Austrian (7.8%, a difference of 0.060%), and Australian (7.8%, a difference of 0.070%).
| Demographics | Rating | Rank | Family Poverty |
| Koreans | 98.3 /100 | #64 | Exceptional 7.8% |
| Immigrants | Bulgaria | 98.3 /100 | #65 | Exceptional 7.8% |
| Dutch | 98.3 /100 | #66 | Exceptional 7.8% |
| Northern Europeans | 98.3 /100 | #67 | Exceptional 7.8% |
| Australians | 98.2 /100 | #68 | Exceptional 7.8% |
| Immigrants | Belgium | 98.2 /100 | #69 | Exceptional 7.8% |
| Immigrants | Canada | 98.2 /100 | #70 | Exceptional 7.8% |
| Cambodians | 98.2 /100 | #71 | Exceptional 7.8% |
| Immigrants | Romania | 98.2 /100 | #72 | Exceptional 7.8% |
| Austrians | 98.2 /100 | #73 | Exceptional 7.8% |
| Immigrants | China | 98.1 /100 | #74 | Exceptional 7.8% |
| Immigrants | Croatia | 98.1 /100 | #75 | Exceptional 7.8% |
| Immigrants | Latvia | 98.0 /100 | #76 | Exceptional 7.9% |
| Ukrainians | 98.0 /100 | #77 | Exceptional 7.9% |
| Immigrants | North America | 97.9 /100 | #78 | Exceptional 7.9% |
Demographics Similar to Ecuadorians by Family Poverty
In terms of family poverty, the demographic groups most similar to Ecuadorians are Immigrants from Western Africa (10.7%, a difference of 0.30%), Immigrants from Liberia (10.8%, a difference of 0.37%), Immigrants from Zaire (10.7%, a difference of 0.41%), Iroquois (10.7%, a difference of 0.53%), and Chickasaw (10.8%, a difference of 0.64%).
| Demographics | Rating | Rank | Family Poverty |
| Liberians | 0.4 /100 | #247 | Tragic 10.6% |
| Nicaraguans | 0.4 /100 | #248 | Tragic 10.6% |
| Cubans | 0.4 /100 | #249 | Tragic 10.6% |
| Salvadorans | 0.3 /100 | #250 | Tragic 10.7% |
| Iroquois | 0.3 /100 | #251 | Tragic 10.7% |
| Immigrants | Zaire | 0.3 /100 | #252 | Tragic 10.7% |
| Immigrants | Western Africa | 0.3 /100 | #253 | Tragic 10.7% |
| Ecuadorians | 0.2 /100 | #254 | Tragic 10.8% |
| Immigrants | Liberia | 0.2 /100 | #255 | Tragic 10.8% |
| Chickasaw | 0.2 /100 | #256 | Tragic 10.8% |
| Immigrants | Ghana | 0.2 /100 | #257 | Tragic 10.8% |
| Sub-Saharan Africans | 0.2 /100 | #258 | Tragic 10.9% |
| Mexican American Indians | 0.2 /100 | #259 | Tragic 10.9% |
| Bangladeshis | 0.2 /100 | #260 | Tragic 10.9% |
| Shoshone | 0.2 /100 | #261 | Tragic 10.9% |