Turkish vs Ecuadorian Family Poverty
COMPARE
Turkish
Ecuadorian
Family Poverty
Family Poverty Comparison
Turks
Ecuadorians
7.5%
FAMILY POVERTY
99.4/ 100
METRIC RATING
36th/ 347
METRIC RANK
10.8%
FAMILY POVERTY
0.2/ 100
METRIC RATING
254th/ 347
METRIC RANK
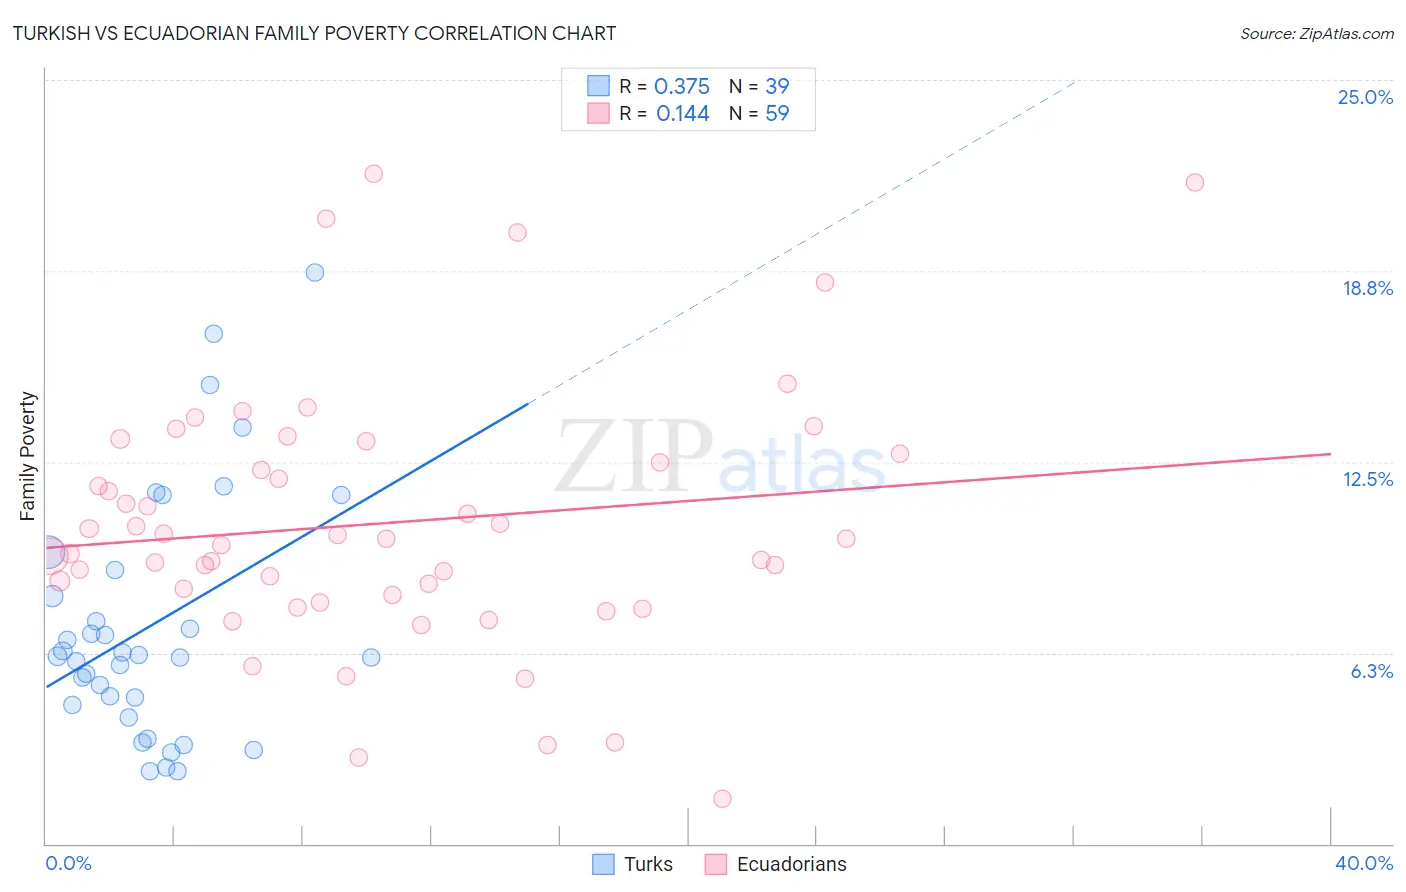
Turkish vs Ecuadorian Family Poverty Correlation Chart
The statistical analysis conducted on geographies consisting of 271,236,955 people shows a mild positive correlation between the proportion of Turks and poverty level among families in the United States with a correlation coefficient (R) of 0.375 and weighted average of 7.5%. Similarly, the statistical analysis conducted on geographies consisting of 317,108,203 people shows a poor positive correlation between the proportion of Ecuadorians and poverty level among families in the United States with a correlation coefficient (R) of 0.144 and weighted average of 10.8%, a difference of 43.5%.
Family Poverty Correlation Summary
| Measurement | Turkish | Ecuadorian |
| Minimum | 2.4% | 1.5% |
| Maximum | 18.7% | 21.9% |
| Range | 16.3% | 20.5% |
| Mean | 7.1% | 10.5% |
| Median | 6.1% | 10.0% |
| Interquartile 25% (IQ1) | 4.5% | 8.1% |
| Interquartile 75% (IQ3) | 9.0% | 12.8% |
| Interquartile Range (IQR) | 4.4% | 4.6% |
| Standard Deviation (Sample) | 4.0% | 4.2% |
| Standard Deviation (Population) | 3.9% | 4.2% |
Similar Demographics by Family Poverty
Demographics Similar to Turks by Family Poverty
In terms of family poverty, the demographic groups most similar to Turks are Greek (7.5%, a difference of 0.010%), Estonian (7.5%, a difference of 0.17%), Bolivian (7.5%, a difference of 0.41%), Carpatho Rusyn (7.5%, a difference of 0.47%), and Slovene (7.5%, a difference of 0.51%).
| Demographics | Rating | Rank | Family Poverty |
| Immigrants | Northern Europe | 99.6 /100 | #29 | Exceptional 7.4% |
| Italians | 99.6 /100 | #30 | Exceptional 7.4% |
| Czechs | 99.6 /100 | #31 | Exceptional 7.4% |
| Poles | 99.5 /100 | #32 | Exceptional 7.4% |
| Immigrants | Japan | 99.5 /100 | #33 | Exceptional 7.4% |
| Russians | 99.5 /100 | #34 | Exceptional 7.5% |
| Greeks | 99.4 /100 | #35 | Exceptional 7.5% |
| Turks | 99.4 /100 | #36 | Exceptional 7.5% |
| Estonians | 99.4 /100 | #37 | Exceptional 7.5% |
| Bolivians | 99.3 /100 | #38 | Exceptional 7.5% |
| Carpatho Rusyns | 99.3 /100 | #39 | Exceptional 7.5% |
| Slovenes | 99.3 /100 | #40 | Exceptional 7.5% |
| Immigrants | Australia | 99.2 /100 | #41 | Exceptional 7.6% |
| Scandinavians | 99.1 /100 | #42 | Exceptional 7.6% |
| Immigrants | Austria | 99.1 /100 | #43 | Exceptional 7.6% |
Demographics Similar to Ecuadorians by Family Poverty
In terms of family poverty, the demographic groups most similar to Ecuadorians are Immigrants from Western Africa (10.7%, a difference of 0.30%), Immigrants from Liberia (10.8%, a difference of 0.37%), Immigrants from Zaire (10.7%, a difference of 0.41%), Iroquois (10.7%, a difference of 0.53%), and Chickasaw (10.8%, a difference of 0.64%).
| Demographics | Rating | Rank | Family Poverty |
| Liberians | 0.4 /100 | #247 | Tragic 10.6% |
| Nicaraguans | 0.4 /100 | #248 | Tragic 10.6% |
| Cubans | 0.4 /100 | #249 | Tragic 10.6% |
| Salvadorans | 0.3 /100 | #250 | Tragic 10.7% |
| Iroquois | 0.3 /100 | #251 | Tragic 10.7% |
| Immigrants | Zaire | 0.3 /100 | #252 | Tragic 10.7% |
| Immigrants | Western Africa | 0.3 /100 | #253 | Tragic 10.7% |
| Ecuadorians | 0.2 /100 | #254 | Tragic 10.8% |
| Immigrants | Liberia | 0.2 /100 | #255 | Tragic 10.8% |
| Chickasaw | 0.2 /100 | #256 | Tragic 10.8% |
| Immigrants | Ghana | 0.2 /100 | #257 | Tragic 10.8% |
| Sub-Saharan Africans | 0.2 /100 | #258 | Tragic 10.9% |
| Mexican American Indians | 0.2 /100 | #259 | Tragic 10.9% |
| Bangladeshis | 0.2 /100 | #260 | Tragic 10.9% |
| Shoshone | 0.2 /100 | #261 | Tragic 10.9% |