Cambodian vs Ecuadorian Unemployment
COMPARE
Cambodian
Ecuadorian
Unemployment
Unemployment Comparison
Cambodians
Ecuadorians
4.9%
UNEMPLOYMENT
99.0/ 100
METRIC RATING
61st/ 347
METRIC RANK
6.2%
UNEMPLOYMENT
0.0/ 100
METRIC RATING
288th/ 347
METRIC RANK
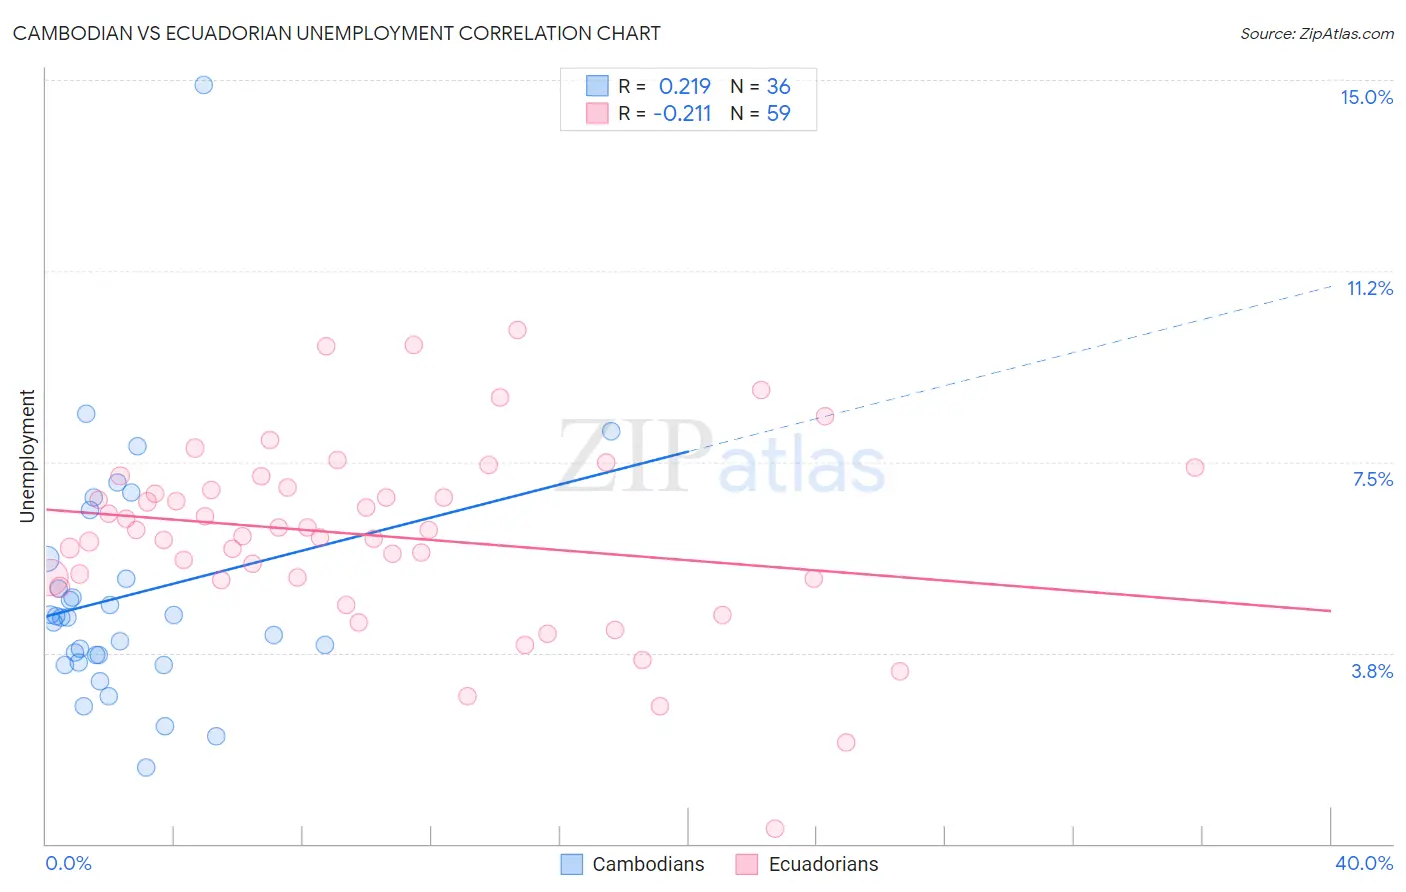
Cambodian vs Ecuadorian Unemployment Correlation Chart
The statistical analysis conducted on geographies consisting of 102,491,878 people shows a weak positive correlation between the proportion of Cambodians and unemployment in the United States with a correlation coefficient (R) of 0.219 and weighted average of 4.9%. Similarly, the statistical analysis conducted on geographies consisting of 317,664,443 people shows a weak negative correlation between the proportion of Ecuadorians and unemployment in the United States with a correlation coefficient (R) of -0.211 and weighted average of 6.2%, a difference of 26.3%.
Unemployment Correlation Summary
| Measurement | Cambodian | Ecuadorian |
| Minimum | 1.5% | 0.30% |
| Maximum | 14.9% | 10.1% |
| Range | 13.4% | 9.8% |
| Mean | 4.9% | 6.0% |
| Median | 4.4% | 6.2% |
| Interquartile 25% (IQ1) | 3.6% | 5.2% |
| Interquartile 75% (IQ3) | 5.4% | 7.0% |
| Interquartile Range (IQR) | 1.8% | 1.8% |
| Standard Deviation (Sample) | 2.4% | 1.8% |
| Standard Deviation (Population) | 2.4% | 1.8% |
Similar Demographics by Unemployment
Demographics Similar to Cambodians by Unemployment
In terms of unemployment, the demographic groups most similar to Cambodians are Immigrants from Netherlands (4.9%, a difference of 0.0%), Icelander (4.9%, a difference of 0.010%), Immigrants from Bulgaria (4.9%, a difference of 0.030%), Bhutanese (4.9%, a difference of 0.050%), and Greek (4.9%, a difference of 0.070%).
| Demographics | Rating | Rank | Unemployment |
| Eastern Europeans | 99.2 /100 | #54 | Exceptional 4.9% |
| Australians | 99.2 /100 | #55 | Exceptional 4.9% |
| Celtics | 99.1 /100 | #56 | Exceptional 4.9% |
| Immigrants | Singapore | 99.1 /100 | #57 | Exceptional 4.9% |
| Greeks | 99.0 /100 | #58 | Exceptional 4.9% |
| Bhutanese | 99.0 /100 | #59 | Exceptional 4.9% |
| Immigrants | Netherlands | 99.0 /100 | #60 | Exceptional 4.9% |
| Cambodians | 99.0 /100 | #61 | Exceptional 4.9% |
| Icelanders | 98.9 /100 | #62 | Exceptional 4.9% |
| Immigrants | Bulgaria | 98.9 /100 | #63 | Exceptional 4.9% |
| Italians | 98.9 /100 | #64 | Exceptional 4.9% |
| Immigrants | Canada | 98.8 /100 | #65 | Exceptional 4.9% |
| Slovaks | 98.7 /100 | #66 | Exceptional 4.9% |
| New Zealanders | 98.6 /100 | #67 | Exceptional 4.9% |
| Slavs | 98.6 /100 | #68 | Exceptional 4.9% |
Demographics Similar to Ecuadorians by Unemployment
In terms of unemployment, the demographic groups most similar to Ecuadorians are Nepalese (6.2%, a difference of 0.030%), Chippewa (6.2%, a difference of 0.35%), Immigrants from Caribbean (6.2%, a difference of 0.36%), Senegalese (6.2%, a difference of 0.44%), and Immigrants from Senegal (6.1%, a difference of 0.79%).
| Demographics | Rating | Rank | Unemployment |
| Africans | 0.0 /100 | #281 | Tragic 6.1% |
| Immigrants | Azores | 0.0 /100 | #282 | Tragic 6.1% |
| Immigrants | Ghana | 0.0 /100 | #283 | Tragic 6.1% |
| Aleuts | 0.0 /100 | #284 | Tragic 6.1% |
| Immigrants | Senegal | 0.0 /100 | #285 | Tragic 6.1% |
| Immigrants | Caribbean | 0.0 /100 | #286 | Tragic 6.2% |
| Nepalese | 0.0 /100 | #287 | Tragic 6.2% |
| Ecuadorians | 0.0 /100 | #288 | Tragic 6.2% |
| Chippewa | 0.0 /100 | #289 | Tragic 6.2% |
| Senegalese | 0.0 /100 | #290 | Tragic 6.2% |
| Haitians | 0.0 /100 | #291 | Tragic 6.2% |
| Central American Indians | 0.0 /100 | #292 | Tragic 6.2% |
| Immigrants | Ecuador | 0.0 /100 | #293 | Tragic 6.2% |
| Spanish American Indians | 0.0 /100 | #294 | Tragic 6.2% |
| U.S. Virgin Islanders | 0.0 /100 | #295 | Tragic 6.3% |