Cajun vs Immigrants from Croatia Male Poverty
COMPARE
Cajun
Immigrants from Croatia
Male Poverty
Male Poverty Comparison
Cajuns
Immigrants from Croatia
13.9%
MALE POVERTY
0.0/ 100
METRIC RATING
296th/ 347
METRIC RANK
10.0%
MALE POVERTY
98.7/ 100
METRIC RATING
51st/ 347
METRIC RANK
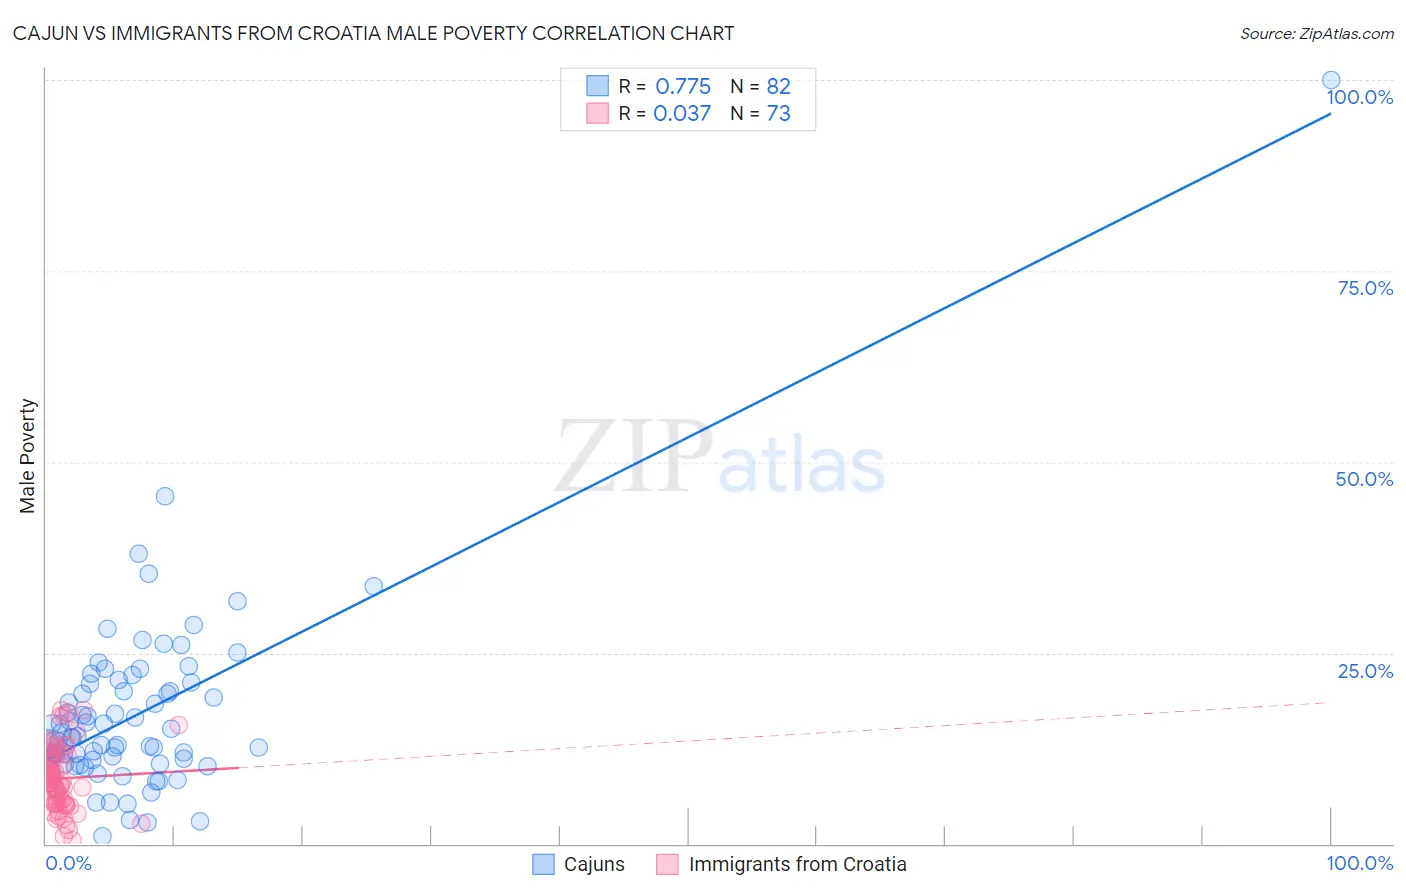
Cajun vs Immigrants from Croatia Male Poverty Correlation Chart
The statistical analysis conducted on geographies consisting of 149,683,084 people shows a strong positive correlation between the proportion of Cajuns and poverty level among males in the United States with a correlation coefficient (R) of 0.775 and weighted average of 13.9%. Similarly, the statistical analysis conducted on geographies consisting of 132,552,240 people shows no correlation between the proportion of Immigrants from Croatia and poverty level among males in the United States with a correlation coefficient (R) of 0.037 and weighted average of 10.0%, a difference of 39.1%.
Male Poverty Correlation Summary
| Measurement | Cajun | Immigrants from Croatia |
| Minimum | 0.97% | 0.43% |
| Maximum | 100.0% | 17.5% |
| Range | 99.0% | 17.1% |
| Mean | 17.0% | 8.6% |
| Median | 13.9% | 8.2% |
| Interquartile 25% (IQ1) | 10.9% | 5.3% |
| Interquartile 75% (IQ3) | 20.9% | 11.5% |
| Interquartile Range (IQR) | 10.0% | 6.2% |
| Standard Deviation (Sample) | 12.4% | 4.1% |
| Standard Deviation (Population) | 12.3% | 4.0% |
Similar Demographics by Male Poverty
Demographics Similar to Cajuns by Male Poverty
In terms of male poverty, the demographic groups most similar to Cajuns are Immigrants from Central America (13.9%, a difference of 0.11%), Hispanic or Latino (13.9%, a difference of 0.40%), Immigrants from Belize (13.8%, a difference of 0.45%), Indonesian (13.8%, a difference of 0.46%), and Vietnamese (13.8%, a difference of 0.63%).
| Demographics | Rating | Rank | Male Poverty |
| Guatemalans | 0.0 /100 | #289 | Tragic 13.8% |
| Immigrants | Zaire | 0.0 /100 | #290 | Tragic 13.8% |
| Vietnamese | 0.0 /100 | #291 | Tragic 13.8% |
| Indonesians | 0.0 /100 | #292 | Tragic 13.8% |
| Immigrants | Belize | 0.0 /100 | #293 | Tragic 13.8% |
| Hispanics or Latinos | 0.0 /100 | #294 | Tragic 13.9% |
| Immigrants | Central America | 0.0 /100 | #295 | Tragic 13.9% |
| Cajuns | 0.0 /100 | #296 | Tragic 13.9% |
| Inupiat | 0.0 /100 | #297 | Tragic 14.0% |
| Blackfeet | 0.0 /100 | #298 | Tragic 14.0% |
| Immigrants | Guatemala | 0.0 /100 | #299 | Tragic 14.0% |
| Immigrants | Mexico | 0.0 /100 | #300 | Tragic 14.0% |
| Immigrants | Senegal | 0.0 /100 | #301 | Tragic 14.0% |
| Immigrants | Caribbean | 0.0 /100 | #302 | Tragic 14.0% |
| Bahamians | 0.0 /100 | #303 | Tragic 14.1% |
Demographics Similar to Immigrants from Croatia by Male Poverty
In terms of male poverty, the demographic groups most similar to Immigrants from Croatia are Asian (10.0%, a difference of 0.090%), Immigrants from Philippines (10.0%, a difference of 0.10%), Slovene (10.0%, a difference of 0.16%), Immigrants from Czechoslovakia (10.0%, a difference of 0.16%), and Immigrants from Singapore (10.0%, a difference of 0.25%).
| Demographics | Rating | Rank | Male Poverty |
| Immigrants | Romania | 98.9 /100 | #44 | Exceptional 9.9% |
| Immigrants | Serbia | 98.9 /100 | #45 | Exceptional 10.0% |
| Turks | 98.9 /100 | #46 | Exceptional 10.0% |
| Immigrants | Singapore | 98.8 /100 | #47 | Exceptional 10.0% |
| Immigrants | Japan | 98.8 /100 | #48 | Exceptional 10.0% |
| Slovenes | 98.8 /100 | #49 | Exceptional 10.0% |
| Immigrants | Philippines | 98.7 /100 | #50 | Exceptional 10.0% |
| Immigrants | Croatia | 98.7 /100 | #51 | Exceptional 10.0% |
| Asians | 98.7 /100 | #52 | Exceptional 10.0% |
| Immigrants | Czechoslovakia | 98.6 /100 | #53 | Exceptional 10.0% |
| Immigrants | Austria | 98.5 /100 | #54 | Exceptional 10.0% |
| Germans | 98.3 /100 | #55 | Exceptional 10.1% |
| Immigrants | Bulgaria | 98.2 /100 | #56 | Exceptional 10.1% |
| Estonians | 98.1 /100 | #57 | Exceptional 10.1% |
| Scandinavians | 98.0 /100 | #58 | Exceptional 10.1% |