Cajun vs Greek Male Poverty
COMPARE
Cajun
Greek
Male Poverty
Male Poverty Comparison
Cajuns
Greeks
13.9%
MALE POVERTY
0.0/ 100
METRIC RATING
296th/ 347
METRIC RANK
9.7%
MALE POVERTY
99.6/ 100
METRIC RATING
29th/ 347
METRIC RANK
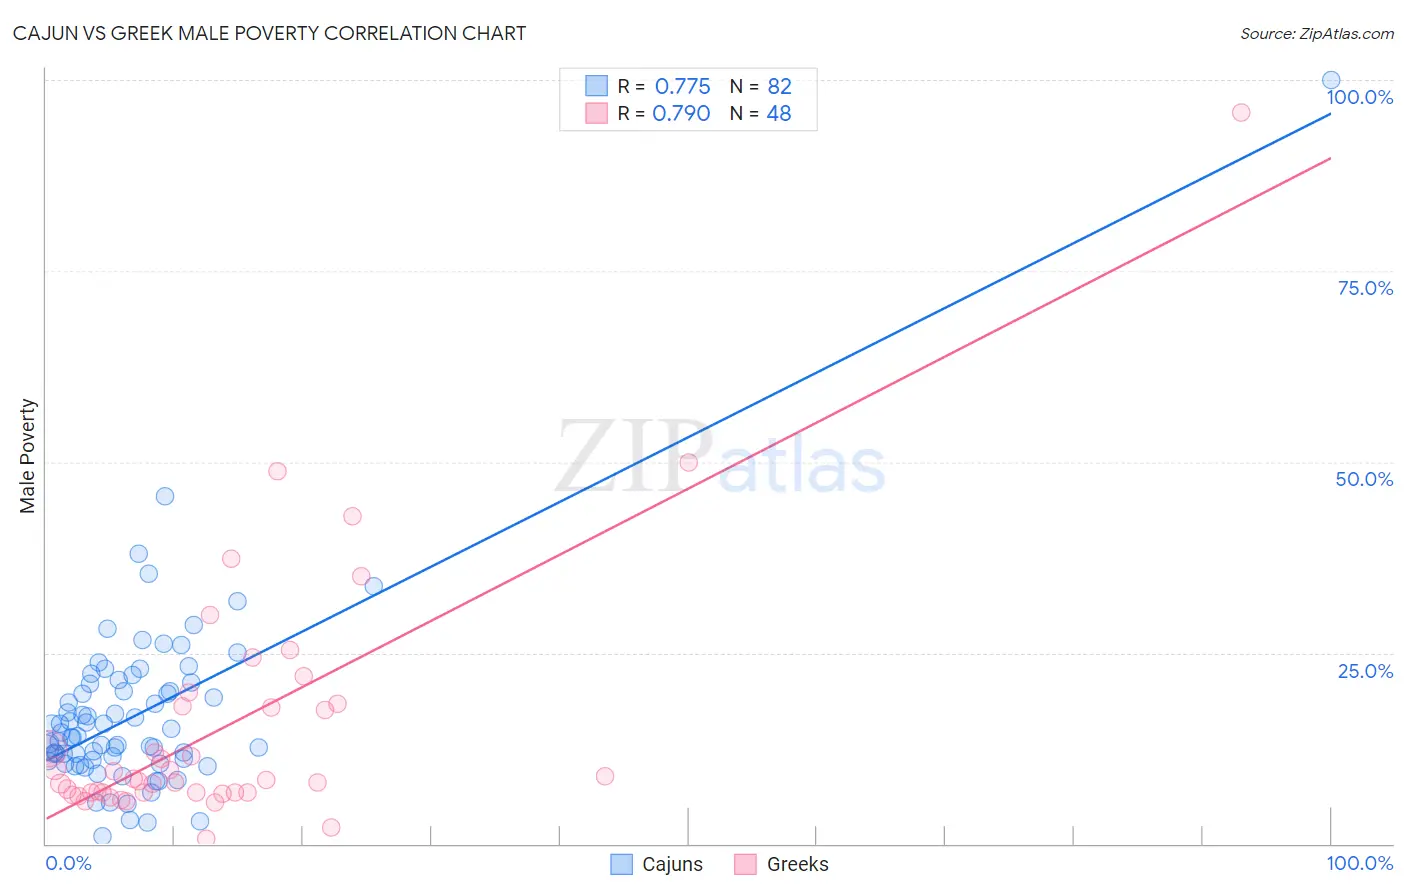
Cajun vs Greek Male Poverty Correlation Chart
The statistical analysis conducted on geographies consisting of 149,683,084 people shows a strong positive correlation between the proportion of Cajuns and poverty level among males in the United States with a correlation coefficient (R) of 0.775 and weighted average of 13.9%. Similarly, the statistical analysis conducted on geographies consisting of 481,993,852 people shows a strong positive correlation between the proportion of Greeks and poverty level among males in the United States with a correlation coefficient (R) of 0.790 and weighted average of 9.7%, a difference of 43.3%.
Male Poverty Correlation Summary
| Measurement | Cajun | Greek |
| Minimum | 0.97% | 0.65% |
| Maximum | 100.0% | 95.7% |
| Range | 99.0% | 95.1% |
| Mean | 17.0% | 15.6% |
| Median | 13.9% | 8.4% |
| Interquartile 25% (IQ1) | 10.9% | 6.7% |
| Interquartile 75% (IQ3) | 20.9% | 18.1% |
| Interquartile Range (IQR) | 10.0% | 11.4% |
| Standard Deviation (Sample) | 12.4% | 16.7% |
| Standard Deviation (Population) | 12.3% | 16.5% |
Similar Demographics by Male Poverty
Demographics Similar to Cajuns by Male Poverty
In terms of male poverty, the demographic groups most similar to Cajuns are Immigrants from Central America (13.9%, a difference of 0.11%), Hispanic or Latino (13.9%, a difference of 0.40%), Immigrants from Belize (13.8%, a difference of 0.45%), Indonesian (13.8%, a difference of 0.46%), and Vietnamese (13.8%, a difference of 0.63%).
| Demographics | Rating | Rank | Male Poverty |
| Guatemalans | 0.0 /100 | #289 | Tragic 13.8% |
| Immigrants | Zaire | 0.0 /100 | #290 | Tragic 13.8% |
| Vietnamese | 0.0 /100 | #291 | Tragic 13.8% |
| Indonesians | 0.0 /100 | #292 | Tragic 13.8% |
| Immigrants | Belize | 0.0 /100 | #293 | Tragic 13.8% |
| Hispanics or Latinos | 0.0 /100 | #294 | Tragic 13.9% |
| Immigrants | Central America | 0.0 /100 | #295 | Tragic 13.9% |
| Cajuns | 0.0 /100 | #296 | Tragic 13.9% |
| Inupiat | 0.0 /100 | #297 | Tragic 14.0% |
| Blackfeet | 0.0 /100 | #298 | Tragic 14.0% |
| Immigrants | Guatemala | 0.0 /100 | #299 | Tragic 14.0% |
| Immigrants | Mexico | 0.0 /100 | #300 | Tragic 14.0% |
| Immigrants | Senegal | 0.0 /100 | #301 | Tragic 14.0% |
| Immigrants | Caribbean | 0.0 /100 | #302 | Tragic 14.0% |
| Bahamians | 0.0 /100 | #303 | Tragic 14.1% |
Demographics Similar to Greeks by Male Poverty
In terms of male poverty, the demographic groups most similar to Greeks are Immigrants from Korea (9.7%, a difference of 0.040%), Polish (9.7%, a difference of 0.080%), Tongan (9.7%, a difference of 0.10%), Danish (9.7%, a difference of 0.12%), and Burmese (9.7%, a difference of 0.25%).
| Demographics | Rating | Rank | Male Poverty |
| Croatians | 99.7 /100 | #22 | Exceptional 9.6% |
| Italians | 99.7 /100 | #23 | Exceptional 9.6% |
| Swedes | 99.7 /100 | #24 | Exceptional 9.6% |
| Eastern Europeans | 99.6 /100 | #25 | Exceptional 9.6% |
| Burmese | 99.6 /100 | #26 | Exceptional 9.7% |
| Danes | 99.6 /100 | #27 | Exceptional 9.7% |
| Immigrants | Korea | 99.6 /100 | #28 | Exceptional 9.7% |
| Greeks | 99.6 /100 | #29 | Exceptional 9.7% |
| Poles | 99.5 /100 | #30 | Exceptional 9.7% |
| Tongans | 99.5 /100 | #31 | Exceptional 9.7% |
| Macedonians | 99.5 /100 | #32 | Exceptional 9.7% |
| Immigrants | Northern Europe | 99.5 /100 | #33 | Exceptional 9.7% |
| Immigrants | Poland | 99.5 /100 | #34 | Exceptional 9.8% |
| Iranians | 99.4 /100 | #35 | Exceptional 9.8% |
| Czechs | 99.4 /100 | #36 | Exceptional 9.8% |