Cajun vs Assyrian/Chaldean/Syriac Seniors Poverty Over the Age of 65
COMPARE
Cajun
Assyrian/Chaldean/Syriac
Seniors Poverty Over the Age of 65
Seniors Poverty Over the Age of 65 Comparison
Cajuns
Assyrians/Chaldeans/Syriacs
11.9%
SENIORS POVERTY OVER THE AGE OF 65
2.0/ 100
METRIC RATING
231st/ 347
METRIC RANK
9.6%
SENIORS POVERTY OVER THE AGE OF 65
99.6/ 100
METRIC RATING
40th/ 347
METRIC RANK
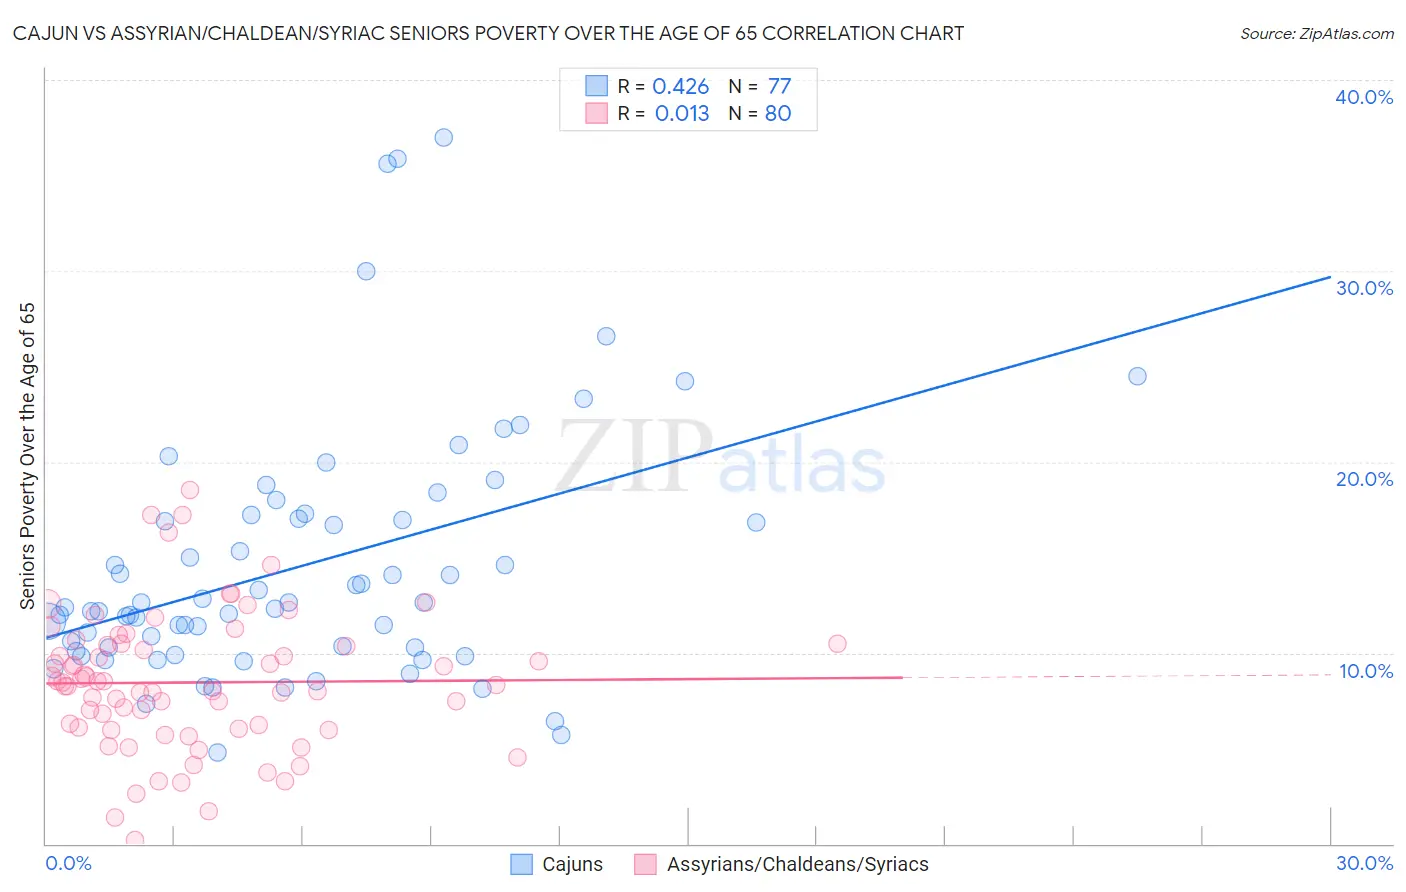
Cajun vs Assyrian/Chaldean/Syriac Seniors Poverty Over the Age of 65 Correlation Chart
The statistical analysis conducted on geographies consisting of 149,395,455 people shows a moderate positive correlation between the proportion of Cajuns and poverty level among seniors over the age of 65 in the United States with a correlation coefficient (R) of 0.426 and weighted average of 11.9%. Similarly, the statistical analysis conducted on geographies consisting of 110,236,385 people shows no correlation between the proportion of Assyrians/Chaldeans/Syriacs and poverty level among seniors over the age of 65 in the United States with a correlation coefficient (R) of 0.013 and weighted average of 9.6%, a difference of 24.0%.
Seniors Poverty Over the Age of 65 Correlation Summary
| Measurement | Cajun | Assyrian/Chaldean/Syriac |
| Minimum | 4.8% | 0.19% |
| Maximum | 37.0% | 18.5% |
| Range | 32.2% | 18.3% |
| Mean | 14.5% | 8.4% |
| Median | 12.4% | 8.4% |
| Interquartile 25% (IQ1) | 10.2% | 6.1% |
| Interquartile 75% (IQ3) | 17.1% | 10.4% |
| Interquartile Range (IQR) | 6.9% | 4.4% |
| Standard Deviation (Sample) | 6.6% | 3.6% |
| Standard Deviation (Population) | 6.6% | 3.6% |
Similar Demographics by Seniors Poverty Over the Age of 65
Demographics Similar to Cajuns by Seniors Poverty Over the Age of 65
In terms of seniors poverty over the age of 65, the demographic groups most similar to Cajuns are Bermudan (11.9%, a difference of 0.050%), Yaqui (11.9%, a difference of 0.14%), Panamanian (11.9%, a difference of 0.24%), Iroquois (11.9%, a difference of 0.33%), and Immigrants from Eritrea (11.8%, a difference of 0.55%).
| Demographics | Rating | Rank | Seniors Poverty Over the Age of 65 |
| Immigrants | Nigeria | 3.4 /100 | #224 | Tragic 11.7% |
| Immigrants | Belarus | 3.2 /100 | #225 | Tragic 11.8% |
| Liberians | 3.2 /100 | #226 | Tragic 11.8% |
| Nigerians | 3.2 /100 | #227 | Tragic 11.8% |
| Immigrants | Costa Rica | 2.7 /100 | #228 | Tragic 11.8% |
| Immigrants | Eritrea | 2.6 /100 | #229 | Tragic 11.8% |
| Bermudans | 2.1 /100 | #230 | Tragic 11.9% |
| Cajuns | 2.0 /100 | #231 | Tragic 11.9% |
| Yaqui | 1.9 /100 | #232 | Tragic 11.9% |
| Panamanians | 1.8 /100 | #233 | Tragic 11.9% |
| Iroquois | 1.7 /100 | #234 | Tragic 11.9% |
| Immigrants | Argentina | 1.3 /100 | #235 | Tragic 12.0% |
| Immigrants | Peru | 1.3 /100 | #236 | Tragic 12.0% |
| Moroccans | 1.2 /100 | #237 | Tragic 12.0% |
| Seminole | 1.1 /100 | #238 | Tragic 12.0% |
Demographics Similar to Assyrians/Chaldeans/Syriacs by Seniors Poverty Over the Age of 65
In terms of seniors poverty over the age of 65, the demographic groups most similar to Assyrians/Chaldeans/Syriacs are Greek (9.6%, a difference of 0.12%), Immigrants from North Macedonia (9.6%, a difference of 0.16%), Zimbabwean (9.6%, a difference of 0.32%), Eastern European (9.6%, a difference of 0.42%), and Austrian (9.6%, a difference of 0.51%).
| Demographics | Rating | Rank | Seniors Poverty Over the Age of 65 |
| Native Hawaiians | 99.8 /100 | #33 | Exceptional 9.4% |
| British | 99.8 /100 | #34 | Exceptional 9.4% |
| Latvians | 99.8 /100 | #35 | Exceptional 9.5% |
| Czechoslovakians | 99.8 /100 | #36 | Exceptional 9.5% |
| Scotch-Irish | 99.7 /100 | #37 | Exceptional 9.5% |
| Belgians | 99.7 /100 | #38 | Exceptional 9.5% |
| Greeks | 99.6 /100 | #39 | Exceptional 9.6% |
| Assyrians/Chaldeans/Syriacs | 99.6 /100 | #40 | Exceptional 9.6% |
| Immigrants | North Macedonia | 99.6 /100 | #41 | Exceptional 9.6% |
| Zimbabweans | 99.6 /100 | #42 | Exceptional 9.6% |
| Eastern Europeans | 99.6 /100 | #43 | Exceptional 9.6% |
| Austrians | 99.5 /100 | #44 | Exceptional 9.6% |
| Estonians | 99.5 /100 | #45 | Exceptional 9.6% |
| Immigrants | Taiwan | 99.5 /100 | #46 | Exceptional 9.7% |
| Immigrants | South Central Asia | 99.5 /100 | #47 | Exceptional 9.7% |